

.svg)
industry insights
Featured Articles
Is Utility Mapping Worth the Cost?
Why Do You Need Updated As-Builts on Your Next Project?
industry insights
Should You Rent, Buy, or Hire a GPR Service?
Should You Rent, Buy, or Hire a GPR Service?
If you're considering ground penetrating radar (GPR) for your next project, you are likely to have questions about how it works, what it can detect, and whether it's better to rent, buy, or hire a service. This guide breaks down the key considerations, so you can make an informed decision that fits your project’s needs, timeline, and budget.
What is Ground Penetrating Radar (GPR)?
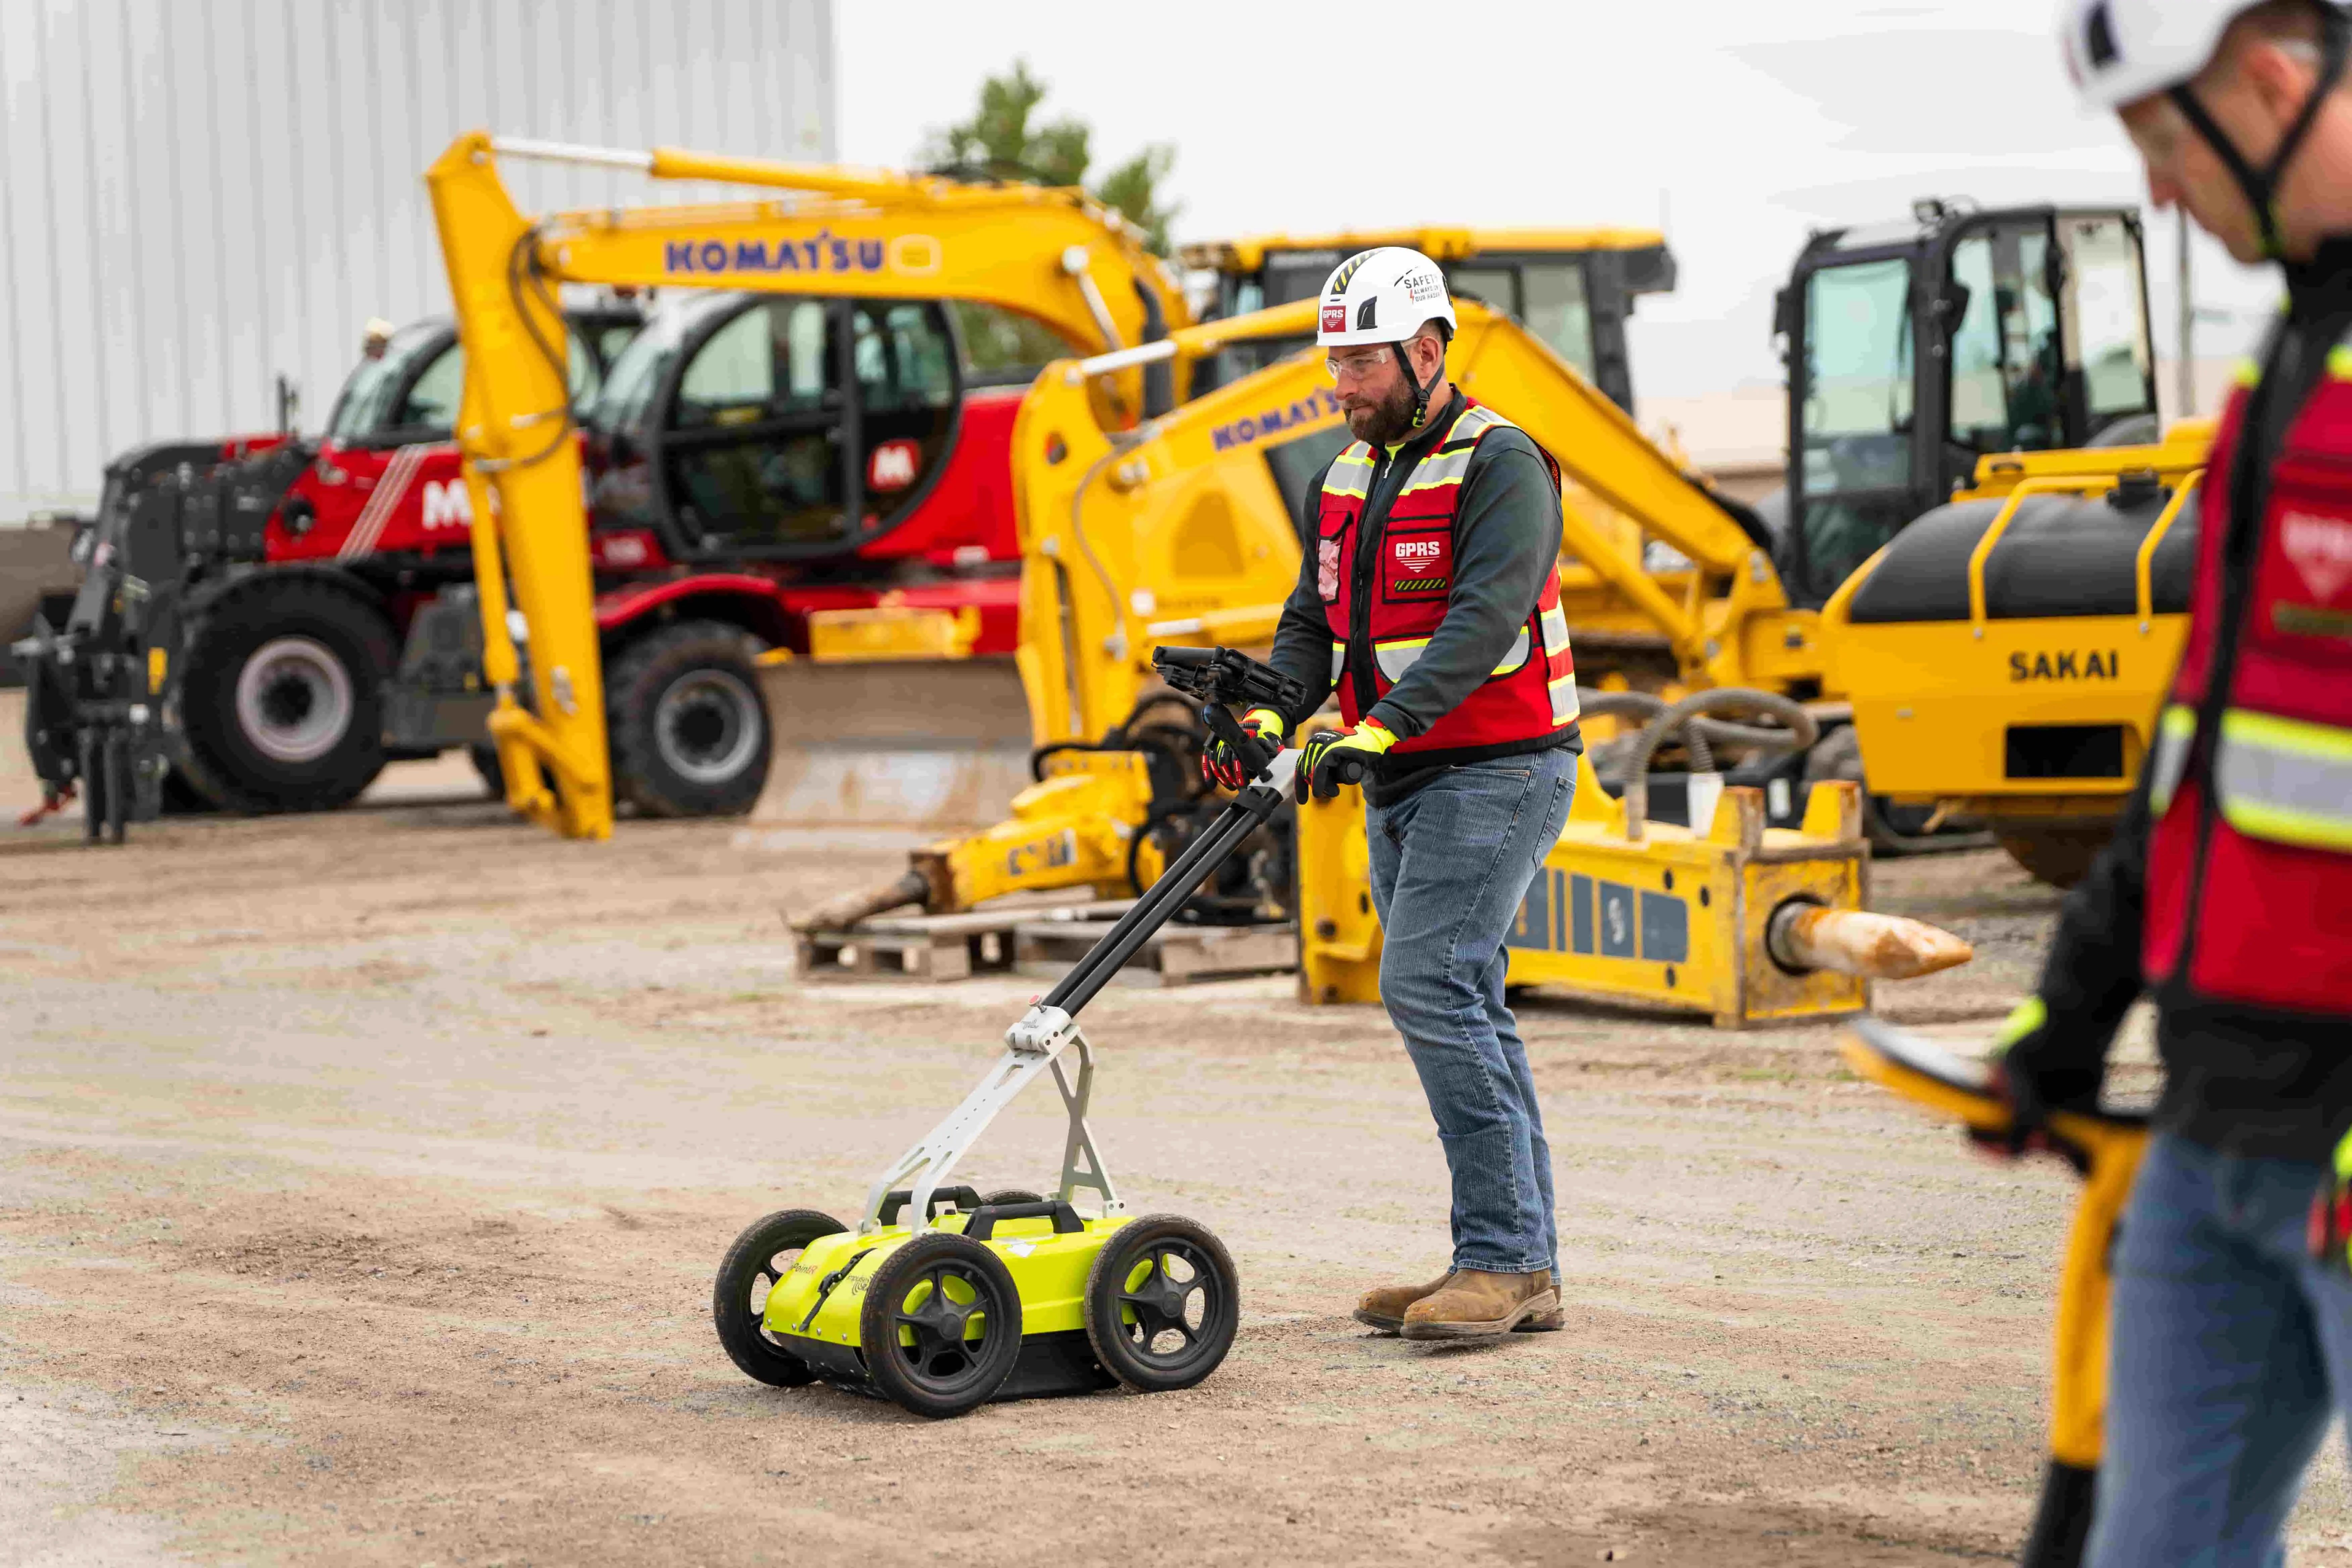
GPR is a safe, non-destructive technology that uses radar pulses to detect and map subsurface features. It’s commonly used to locate underground utilities, scan concrete for embedded objects, and provide detailed imaging for a wide range of applications, from construction and engineering to telecommunications and facility management.
What Can GPR Locate?
GPR can detect a wide variety of subsurface elements, including:
- Utilities: Gas, electric, telecom, and water lines, regardless of whether they are made of metal, PVC, or plastic, or what they carry.
- Concrete Features: Rebar, post-tension cables, conduits, and potential voids.
- Underground Structures: Tunnels, foundations, mines, and potential sinkholes.
- Infrastructure: Septic systems, drain fields, storage tanks, and more.
What are the Benefits of Using GPR Technology?
Using GPR technology for utility locating and concrete scanning before construction or excavation has several key benefits:
- Reliable underground data for better planning and design
- Reduced risk of damaging critical utilities
- Enhanced safety by identifying hidden hazards
- Improved job site coordination and efficiency
- Fewer delays from unexpected findings
- Minimized service disruptions
- Compliance with safety and regulatory standards
How Does GPR Work?
Ground penetrating radar works by sending radar signals into a surface, such as soil, concrete, or asphalt. When these signals encounter an object like a pipe, conduit, or rebar, they reflect back to the surface. A trained technician interprets these reflections to determine what’s below and where it’s located. GPR is a fast, safe, and highly accurate method for detecting subsurface features without the need for digging or drilling. Read Ground Penetrating Radar, Explained.

How Accurate is GPR?
GPR achieves a high level of accuracy, though results can vary depending on the type of material and the conditions of the ground.
At GPRS, we follow strict standards to ensure reliable results in any environment. When scanning concrete, our equipment typically achieves accuracy within ±¼ inch to the center of an object and ±½ inch to its depth. For utility locating, accuracy is generally within ±6 inches to the center and ±10% of the depth. Concrete antennas provide higher resolution for detailed imaging but have limited depth range, while utility antennas scan deeper with slightly lower resolution. Understanding the strengths and limitations of each system helps ensure the right tool is chosen for your project.
How Fast is GPR Data Collected?
GPR data collection is quick, often just a few minutes for small areas. For example, scanning a concrete slab or room may take 5–15 minutes. Larger areas like performing utility locating services for parking lots or construction sites may take a few hours, depending on size and complexity. Speed is influenced by several factors, including the surface type (soil, concrete, asphalt), the level of detail required, and any obstructions or access limitations.
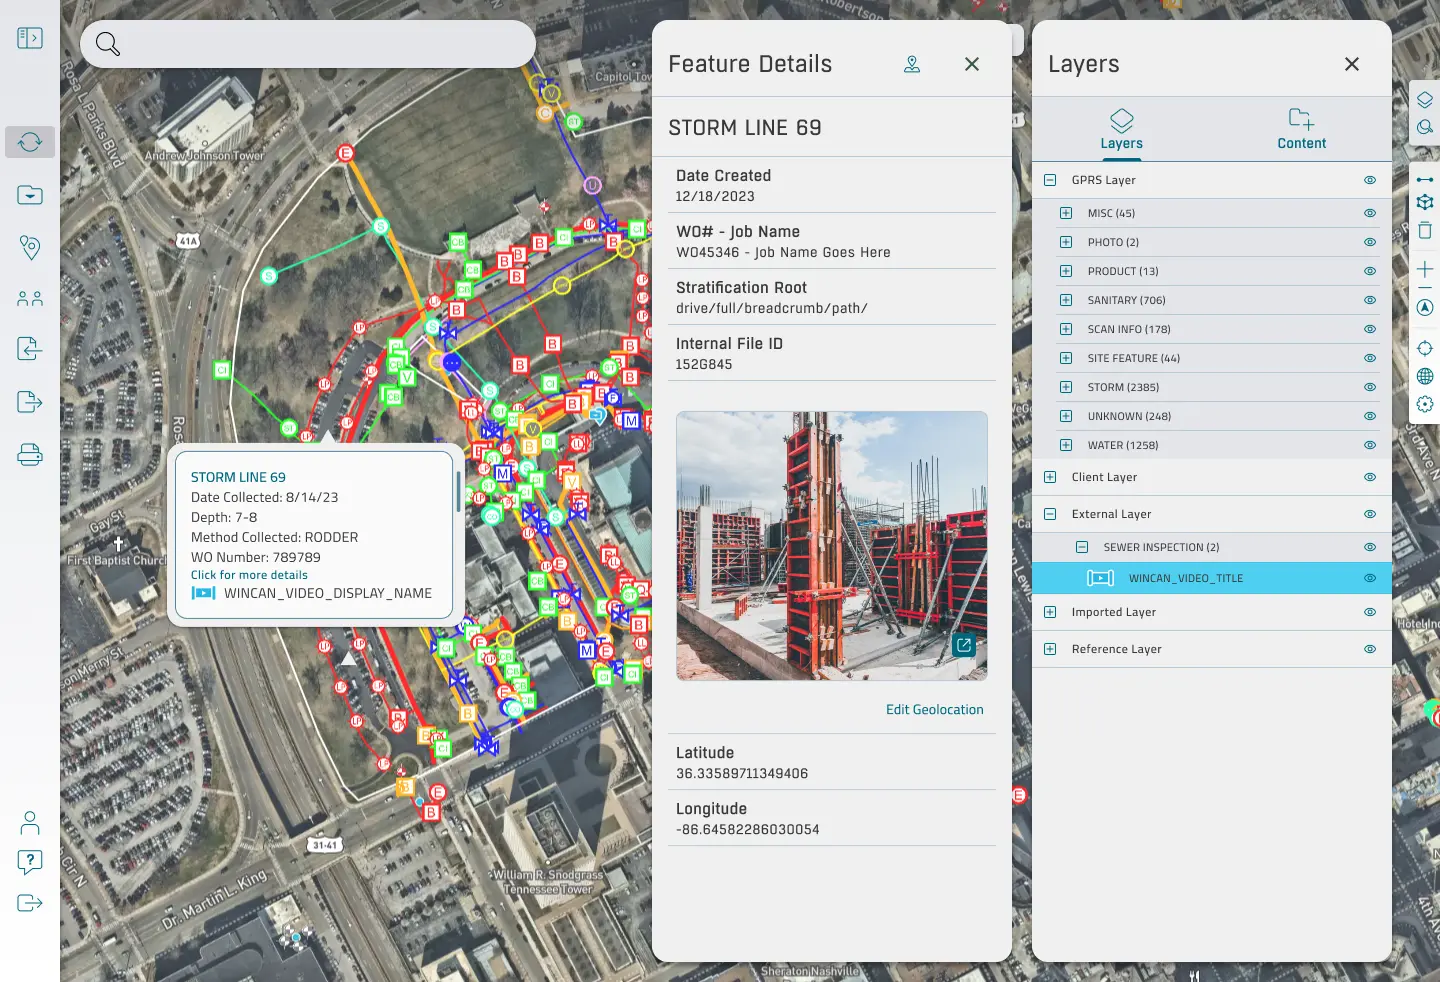
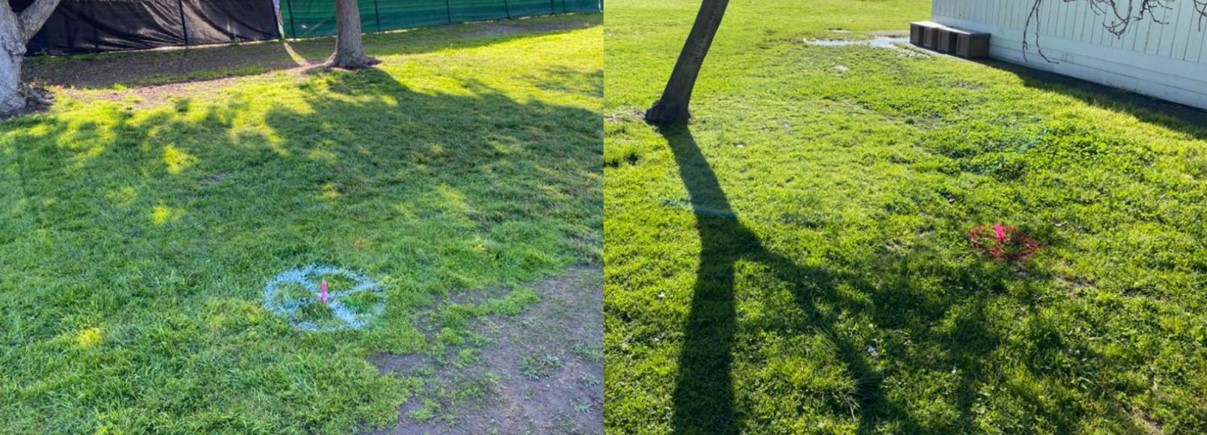
How Do Clients Receive GPR Data After it's Marked on the Ground?
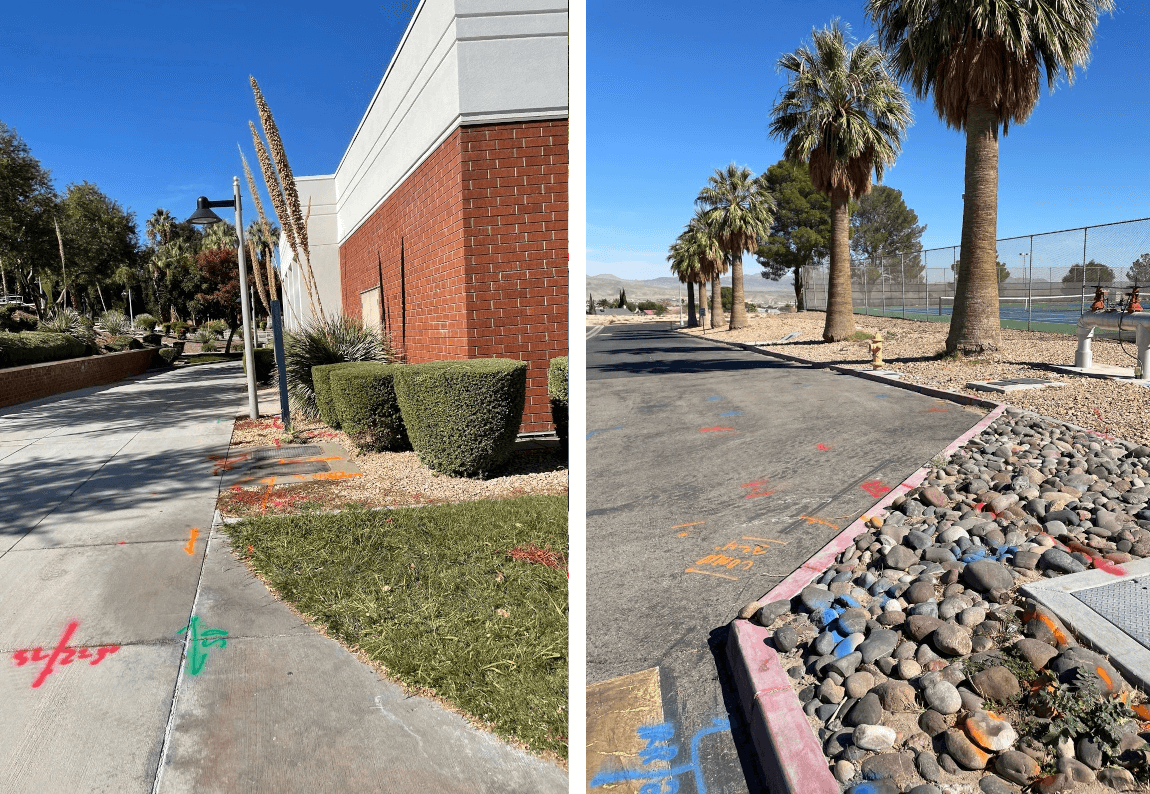
Once GPR locations are marked on the surface, typically using color-coded paint, flags, or chalk for quick visual reference, the data is shared with clients through a combination of field markings, detailed reports, and digital deliverables. Technicians provide a summary of findings that include descriptions of detected features, estimated depths, and supporting site photos. What Do the Utility Marking Colors Mean?
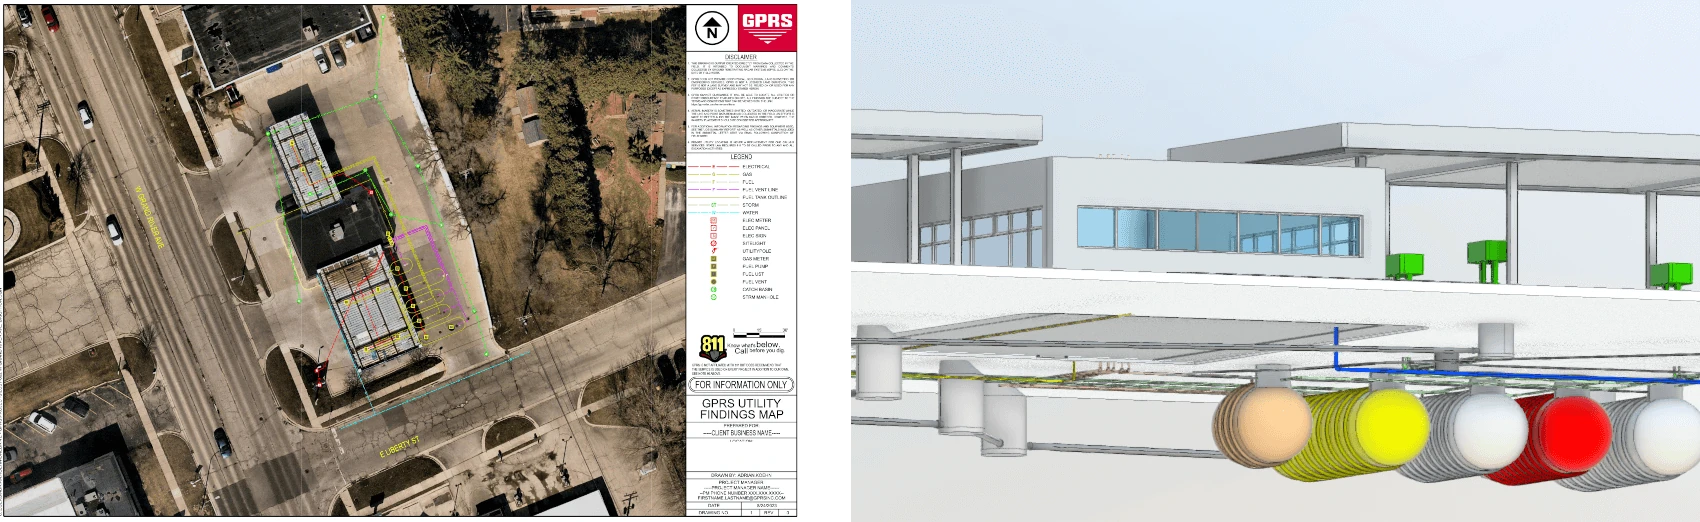
GPR data can be delivered in various digital formats, including PDF utility maps for clear documentation, KMZ files with geolocated points marking specific subsurface features, and SHP files for detailed utility mapping compatible with GIS software.
To create a permanent digital record of surface markings for design and planning, 3D laser scanning or photogrammetry may be used. Data is often provided in BIM, CAD, or GIS formats such as RVT, DWG, DXF, DGN, and more.
GPRS also offers SiteMap®, a cloud-based platform where clients can easily view, download, and manage their subsurface data.

What Does it Cost to Rent a Ground Penetrating Radar Unit?
Based on actual KWIPPED Marketplace supplier quotes, ground penetrating radar rental costs are:
Daily: $284
Weekly: $1,138
Monthly: $3,406
While renting may seem cost-effective for short-term use, it comes with challenges. GPR rental requires significant training and experience to operate effectively. Short rental periods may not allow enough time to become proficient, and interpreting the data without expertise can lead to errors. Environmental factors like wet clay, salt, or rough terrain can also impact results. Over time, frequent GPR rentals can become more expensive than purchasing equipment outright.
When is it Better to Rent GPR Equipment?
Renting is best for short-term projects. It's not cost-effective to buy GPR equipment for just one use. It’s also useful if you already have trained staff and just need temporary access to the technology.
What Does it Cost to Purchase a Ground Penetrating Radar Unit?
Based on actual KWIPPED Marketplace supplier quotes, the cost to buy a ground penetrating radar unit is:
Average purchase price: $19,228
Purchasing GPR equipment offers long-term advantages. It lets you control usage fully. You can customize it for your project's needs. Plus, it removes those recurring rental fees. While the initial investment is higher, ownership becomes more cost-effective for regular users. It also ensures faster deployment and steady availability. Plus, it boosts project efficiency with reliable, high-quality subsurface imaging.
Who Should Consider Buying GPR Equipment?
Organizations that often perform subsurface investigations, such as construction firms, environmental consultants, or utility companies, can benefit from purchasing GPR equipment. It allows for flexible use, faster deployment, and long-term cost savings.
What is the Downside to Buying GPR Equipment?
Buying GPR equipment requires a big upfront cost. Also, owning it means handling tasks like maintenance, software updates, storage, and training staff. It’s not ideal for occasional use or teams without GPR expertise.
Why Hire a Ground Penetrating Radar (GPR) Service?
Hiring a GPR service is a smart choice. You get expert subsurface imaging without the hassle of owning equipment. It’s efficient and cost-effective. Professional GPR service providers offer expert knowledge and the right tools. Their experience helps interpret data better, leading to more accurate and useful results. This is ideal for critical projects, or when a fast turnaround is essential. Outsourcing takes away the hassle of maintaining equipment, updating software, and ensuring safety compliance. This makes it a cost-effective and low-risk choice.
What are the Benefits of Hiring a GPR Service?
- Expertise and Accuracy: Trained technicians assess the site, select the right equipment, and deliver precise data interpretation, reducing the risk of errors.
- Speed and Efficiency: GPR scans can be completed quickly, with real-time results and rapid post-processing, helping to keep projects on schedule.
- Access to Advanced Technology: Service providers often use the latest GPR systems, ensuring high-resolution imaging and reliable detection of subsurface features.
- Improved Safety: Accurate location of utilities, rebar, and other hidden hazards minimizes the risk of accidental strikes during excavation or drilling.
- Cost Savings: For short-term or infrequent needs, hiring a service is more economical than purchasing equipment, avoiding costs related to storage, maintenance, and training.

What Factors Should Influence My Decision to Rent, Buy, or Hire a GPR Service?
Think about your project's frequency, budget, timeline, staff skills, and how accurate you need it to be. If you need fast, reliable results without investing in training or equipment, hiring a GPR service is usually the best choice.
What are Some Examples of Projects Where Hiring a GPR Service is the Best Option?
On a construction site, before excavation begins, GPR is used to locate underground utilities like gas lines, water pipes, and electrical conduits. It is best to hire a GPR service for expert interpretation and safety compliance, especially for one-time or high-risk projects.
When renovating an office building, GPR is an essential tool for scanning concrete slabs to locate rebar, post-tension cables, and conduits before coring or drilling. For the most accurate results and safety assurance, it's best to hire a professional concrete scanning service.
During Phase I or II environmental investigations, GPR is used to detect buried tanks, drums, or other anomalies. It is best to hire a service for accurate data collection and reporting, especially when regulatory compliance is required.
Why Hire GPRS?
Every decision you make on a job site can cost time, money, and even lives. That’s why GPRS maintains a consistent 99.8%+ accuracy rate in GPR utility locating and concrete scanning & imaging. Because it’s our job to help you keep your jobs on time, on budget, and safe.
Our nationwide team of elite Project Managers aren’t just expert technicians – they are consultants who help you get what you need to do the job right, and safely. GPRS has completed over 500,000 utility locating and concrete scanning projects across the U.S.
Every GPRS Project Manager is trained in and follows our Subsurface Investigation Methodology (SIM), an industry-leading training program that ensures elite-level performance.
Our teams use multiple technologies to deliver the most accurate utility locating and mapping data available. Whenever possible, we include line depths in our locates and offer flexible data visualization options tailored to your needs.
All data is mapped directly on the site, plus can be mapped in CAD and 3D and uploaded into an interactive, facility management platform, SiteMap, providing accurate, real-world information collected directly from your jobsite.
Before any construction or excavation begins, knowing what lies beneath the surface is critical. GPRS helps you plan with confidence, avoid costly surprises, and keep your project on track.
If you’re looking for ground penetrating radar rental, ground penetrating radar rental near me, GPR rental, GPR rental near me, concrete scanner rental, rebar scanner rental, or concrete scanning service near me, perhaps hiring a GPR utility locating and concrete scanning & imaging service could be the best option for you. Reach out to GPRS for a free project quote today.
Cross Slopes Explained
Cross slopes are key for the safety, function, and durability of roads, sidewalks, and paved surfaces. They help manage water runoff, enhance safety, and ensure structural integrity.
Let’s dive into what cross slopes are, why they matter, how they're designed, and the implications of getting them wrong.
What Is a Cross Slope?
A cross slope refers to the transverse gradient of a surface – i.e. the angle or tilt from one side of a pavement or roadway to the other. It is measured perpendicular to the direction of travel and is typically expressed as a percentage or ratio. For example, a cross slope of 2% means the surface drops 2 units vertically for every 100 units horizontally.
Cross slopes facilitate drainage, allowing water to flow off the surface rather than pooling. This is important for roads, where standing water can lead to hydroplaning, damage the pavement, and increase maintenance costs.
Why Cross Slopes Matter
The importance of cross slopes lies in their ability to manage surface water. Water is one of the most damaging elements to paved infrastructure. Without proper drainage, water can infiltrate pavement layers, weaken structural components, and accelerate wear and tear. Cross slopes help mitigate these risks by directing water toward gutters, drains, or adjacent terrain.
Beyond drainage, cross slopes also contribute to:
- Safety: Preventing water accumulation reduces the risk of skidding and hydroplaning for vehicles
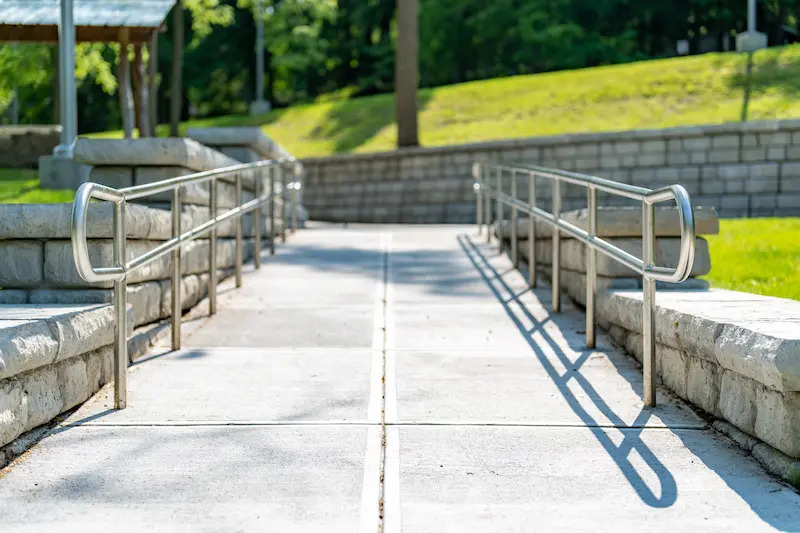
- Accessibility: Well-designed cross slopes meet ADA (Americans with Disabilities Act) standards. This makes sidewalks and ramps easier for people with disabilities to navigate.
- Durability: Cross slopes reduce water infiltration, which helps pavements last longer.
Typical Applications of Cross Slopes
Cross slopes are used in a variety of contexts, each with specific design considerations:
Roadways
In road design, engineers apply cross slopes to the travel lanes and shoulders. The slope typically ranges from 1.5% to 2.5%, depending on the type of road and expected traffic volume. Highways often have steeper slopes to drain water quickly. In contrast, urban streets use gentler gradients. This helps balance drainage needs with pedestrian comfort.
Sidewalks and Pedestrian Paths
Sidewalks need careful cross slope design to ensure both drainage and accessibility. The ADA sets a maximum cross slope of 2% for pedestrian paths. This rule helps wheelchair users and others with mobility challenges.
Parking Lots
In parking areas, cross slopes direct water toward collection points without creating discomfort for pedestrians or vehicles. The slope must be subtle enough to avoid uneven parking surfaces but steep enough to prevent pooling.
Ramps and Driveways
Ramps, especially those used for accessibility, must balance slope requirements for drainage with strict ADA guidelines. Excessive cross slopes can make navigation difficult or unsafe.
Designing Cross Slopes: Key Considerations
Designing an effective cross slope involves a blend of engineering principles, regulatory compliance, and practical judgment. Several factors influence the ideal slope:
Surface Material
Different paving materials have distinct reactions to water and wear. Asphalt is more flexible, so it can handle slight changes in slope. In contrast, concrete needs precise grading.
Climate and Rainfall
Regions with heavy rainfall demand steeper cross slopes to ensure rapid drainage. Arid areas may prioritize comfort and accessibility over aggressive water management.
Traffic Type and Volume
High-speed roads use steeper slopes to lower the risk of hydroplaning. Low-speed urban streets have gentler gradients to improve pedestrian safety.
Regulatory Standards
Designers must follow local and national standards. These include guidelines from the Federal Highway Administration (FHWA) and the ADA. They outline acceptable slope ranges for various uses.
Measuring and Implementing Cross Slopes
Cross slopes are often measured using surveying tools or digital devices during design and construction. The slope is calculated using the formula:
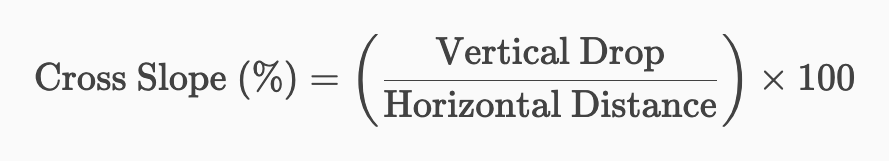
During construction, achieving the correct slope requires precise grading and compaction. Contractors use laser levels, string lines, and automated machinery to ensure consistency across the surface.
Common Challenges and Mistakes
Despite its apparent simplicity, cross slope design can be fraught with challenges. Some common issues include:
Inadequate Slope
A slope that is too shallow may fail to effectively drain water, leading to puddling and long-term damage.
Excessive Slope
Overly steep slopes can create discomfort for drivers and pedestrians and may violate ADA standards.
Uneven Transitions
Bad transitions between slope areas, like from a sidewalk to a ramp, can cause tripping hazards and accessibility issues.
Settlement and Deformation
Pavement can settle or change shape over time due to traffic loads or unstable subgrades. These changes can alter the original slope and affect drainage.
Innovations and Technology in Cross Slope Design
Modern engineering offers various tools and technologies to enhance cross slope design and implementation:
- 3D Modeling and BIM (Building Information Modeling): Allows designers to visualize slope gradients in a digital environment prior to construction.
- Automated Grading Equipment: GPS-guided machinery ensures precise slope creation during paving.
- Smart Sensors: Embedded sensors can track slope integrity, alerting maintenance teams to changes or failures.
Cross Slopes and Sustainability
Sustainable infrastructure design increasingly considers the environmental impact of drainage systems.
Cross slopes play a role in green infrastructure by directing water toward permeable surfaces, bioswales, or rain gardens. This reduces runoff into storm drains and promotes groundwater recharge.
In urban planning, integrating cross slopes with low-impact development (LID) strategies helps cities manage stormwater more effectively while enhancing aesthetics and ecological value.
GPRS offers construction-grade reality capture services to help you inspect ramps and cross slopes. Our laser scanners collect the accurate, actionable data that our in-house Mapping & Modeling Team needs to create floor plans, virtual walkthroughs, BIM models, and whatever other deliverables you need to get the job done right.
What can we help you visualize?
Frequently Asked Questions
How Long Does 3D Laser Scanning Take?
With Project Managers all over the U.S., GPRS works quickly to provide detailed quotes for clients. For most jobs, large areas can be laser scanned in as little as a couple of hours or larger sites in as little as a few days. Entire facilities or campuses can take several weeks to capture the entire site, but most projects are measured in hours or days.
What if My Project is Limited in the Physical Setting?
Some projects require special applications due to limitations within the physical setting. Often times this is due to line-of-sight issues and when a scan must be done safely from the ground or with precautionary distance. Some of these applications would include above-ceiling MEP features in hospitals where it is necessary to maintain negative airflow or interstitial spaces that are congested with limited access. Since laser scanning is a non-contact measurement tool (i.e. we can scan from a safe distance or location) this becomes a powerful tool for solving these complex challenges.
GPRS Reality Capture Services Expedite Installation of LED Display at NBA Arena
GPRS’ reality capture services helped ensure the safety and success of the installation of a large LED display at a professional basketball arena.
Daktronics tasked GPRS Project Manager Brian Nicholson with scanning an area of the concourse at the Spectrum Center, the home of the NBA’s Charlotte Hornets. Daktronics is a nationwide manufacturer of video displays and digital billboards. They were preparing to install a 220’ x 8’ curved LED screen in the arena’s concourse.
“They have this huge steel structure mounted to the ceiling and the columns,” Nicholson explained. “To install the new video board, they need to confirm that the steel structure meets the correct dimensions and that the curvature to it is correct.”
Without precise measurements of the structure, the client risked damaging the LED display and delaying the project – which would have cost them time and money.
Nicholson deployed the Leica RTC360 laser scanner to capture 2-4 mm accurate data of the area.
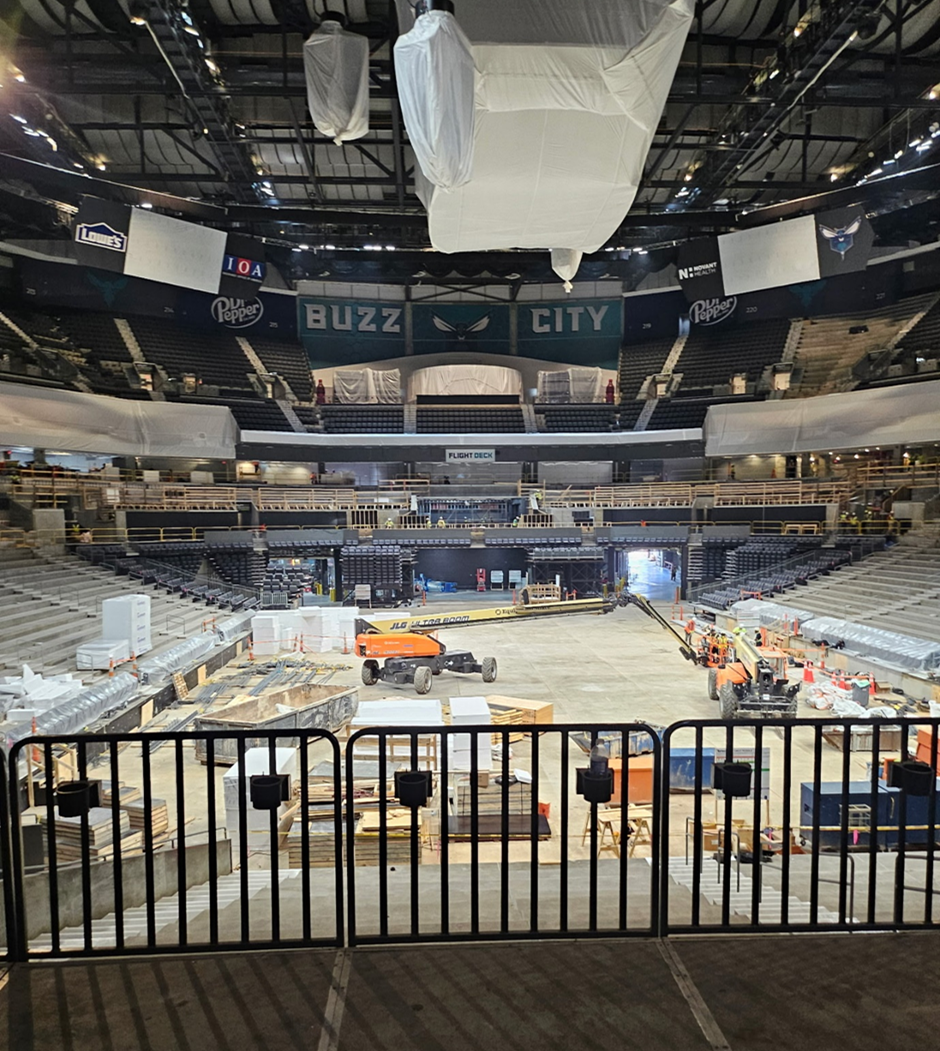
Along with the installation of the new LED display, the arena was undergoing many other offseason restoration projects. Scanning of the project area needed to happen around heavy foot traffic and could not disrupt these other operations.
“There was a lot of other stuff going on there and if there's vibrations, that'll throw off the laser scanner,” Nicholson explained. “So, anytime that I was setting up on a platform and they were also driving over a forklift or something like that, I'd have to rescan after they passed by, because their vibrations would mess up the scanning process.”
Nicholson’s training and experience helped him ensure that outside factors would not compromise any of the scans.
The scanning process took roughly an hour. Once Nicholson completed the scans, the point cloud data was sent off to GPRS’ in-house Mapping & Modeling Team.
Point cloud data refers to the data points collected by 3D laser scanners, like the Leica RTC360. Point clouds are also the foundation used by our Mapping & Modeling Team to create 2D CAD drawings and 3D BIM models.
%20(1).jpg)
With the point cloud data collected by Nicholson, the Mapping & Modeling Team created a 3D model of the steel structure.
Now that they have a highly accurate model of the area, Daktronics can assess with precision whether the structure meets the necessary requirements for the safe and efficient installation of the new LED display. They can also use that data for reference during any future renovations or O&M.
Even though Nicholson prefers football or hockey, he still felt excited about working at this arena for the day.
“I'm a huge football and hockey fan, but being in a sports arena is always cool,” Nicholson said. “I was right at the area where you look straight in and there's the court right there.”
From jumbotrons to skyscrapers, GPRS Visualizes the Built World® to help you Plan, Build, and Manage Better.
What can we help you visualize?
FREQUENTLY ASKED QUESTIONS
How do I know if 3D laser scanning is right for my project?
Almost any project that requires as-built information can benefit from a laser scanning survey. Talk with our experts and start your 3D laser scanning survey project today.
What deliverables can GPRS provide?
We can provide 3D modeling in many formats such as:
- Point Cloud Data (Raw Data)
- 2D CAD Drawings
- 3D Non-Intelligent Models
- 3D BIM Models
- JetStream Viewer
Customizable Deliverables Upon Request
- Aerial Photogrammetry
- Comparative Analysis
- Deformation Analysis
- Digital Drawings of GPR Markings
- Floor Flatness Analysis/Contour Mapping
- New Construction Accuracy Analysis/Comparative Analysis
- Point Cloud Modeling Training Webinars
- Reconciliation of Clients 2D Design Drawings
- Reconciliation of Clients 3D Design Model
- Structural Steel Shape Probability Analysis
- Template Modeling
- Volume Calculations
- Wall Plumb Analysis
GPRS Ensures Safe Installation of EV Chargers at Ohio Service Station
Accurate utility locating data helped ensure the safe and efficient installation of electric vehicle chargers at a service station in Ohio.
GPRS was contracted to locate and map utilities at the station in Cambridge, Ohio prior to the installation of EV chargers.
Project Manager Derrik Clark utilized both electromagnetic (EM) locating and ground penetrating radar (GPR) to locate and map the utilities.
“It's the exact same approach no matter what [the client’s attempting to do],” Clark said. “Because the goal is for them to not hit any existing utilities [when digging] for obvious safety reasons, and then obviously so you’re not interrupting operations or causing anybody to spend money fixing those things. So, for me, there’s never a different approach as to how I’m locating things, regardless of the job type. I find the underground utilities and mark them.”
EM locators detect electromagnetic signals radiating from metallic pipes and cables. These signals can be created by the locator’s transmitter applying current to the pipe, or from current flow in a live electrical cable. They can also result from a conductive pipe acting as an antenna and re-radiating signals from stray electrical fields (detected by the EM locator functioning in Power Mode) and communications transmissions (Radio Mode).

Signals are created by the current flowing from the transmitter which travels along the conductor (line/cable/pipe) and back to the transmitter. The current typically uses a ground to complete the current. A ground stake is used to complete the circuit through the ground.
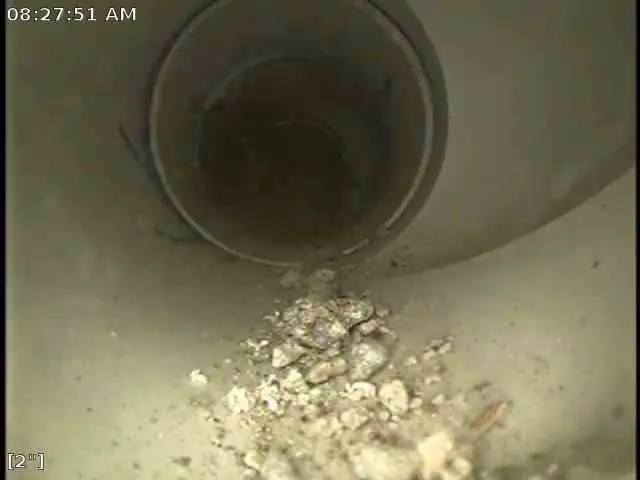
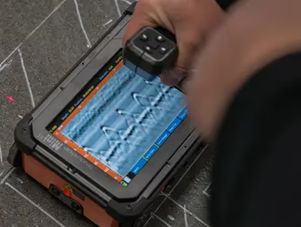
GPR scanners send radio waves into the ground or a surface such as a concrete slab, then detect the interactions between those signals and any subsurface items such as buried utilities, embedded rebar or post tension cable, or underground storage tanks (USTs).
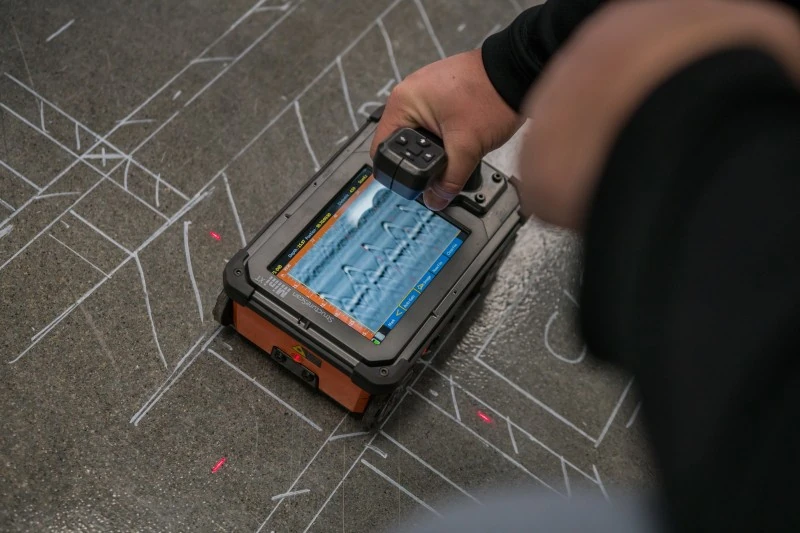
This data is displayed in a GPR readout as a series of hyperbolas, which vary in size and shape depending on what kind of material as detected. GPRS Project Managers are specially trained to interpret this data to tell you what was located, where it’s located, and its estimated depth underground or within the concrete slab.
Our Project Managers utilize both GPR and EM locating when conducting utility locates because they perfectly complement each other’s strengths and weaknesses.
When locating utilities around the service station in Ohio, Clark leaned primarily on EM locating. This was due to an abundance of aboveground contact points which he could use create a traceable signal, and the fact that the soil consistency and other environmental factors were interfering with his GPR scanner’s ability to penetrate the asphalt and soil.
“Max depth with GPR was very poor at this site,” Clark said. “It was like a foot-and-a-half, so that’s why I primarily used the EM locator. It’s always a combination of GPR and EM locating, but since GPR was limited so much I was more relying on the EM locator and hooking on to any surface features that were there.”
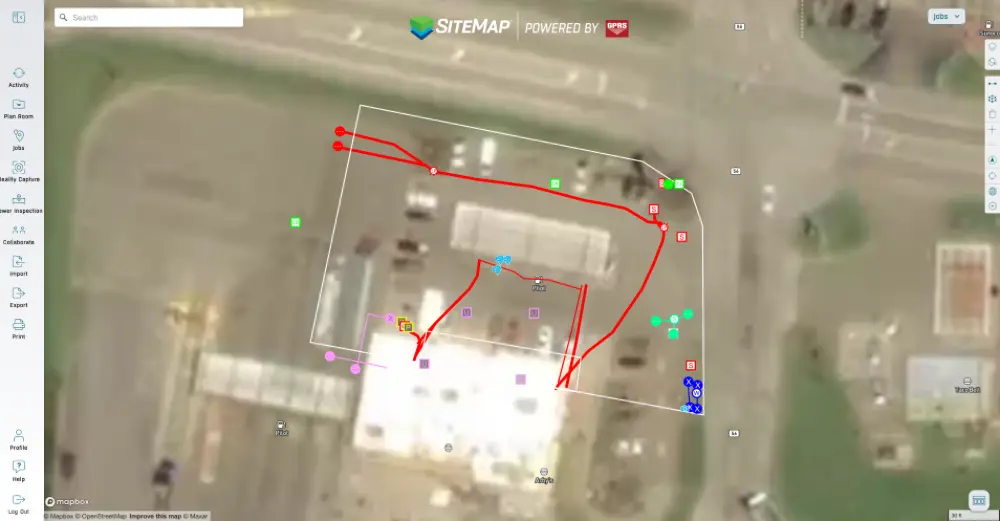
The accurate, actionable utility locating data Clark collected was uploaded into SiteMap® (patent pending), GPRS’ infrastructure mapping, and construction and facilities project management software application designed to help you plan, manage, and build better. Securely accessible 24/7 from any computer, tablet, or smartphone, SiteMap allowed the project team to work around a single source of truth that eliminated the costly and potentially dangerous mistakes so often caused by miscommunication and bad data.
The installer was able to complete their work without striking any buried utilities, ensuring the safety of everyone on-site and the success of their project. Services at the station were able to continue without the disruption that would have occurred due to destructive and expensive potholing to find the buried utilities.
From skyscrapers to sewer lines, GPRS Visualizes The Built World® to keep you on time, on budget, and safe.
What can we help you visualize?
Frequently Asked Questions
What do the utility marking colors mean?
The American Public Works Association (APWA) has established a universal color code to differentiate various utilities:
- Red – Electric power lines, cables, and lighting cables
- Orange – Communication, alarm, signal lines, and fiber optic cables
- Yellow – Gas, oil, steam, petroleum, and other flammable materials
- Green – Sewer and drain lines
- Blue – Potable (drinking) water
- Purple – Reclaimed water, irrigation, and slurry lines
- Pink – Temporary survey markings
- White – Proposed excavation area
What is RTK and why does it matter?
Real-Time Kinematic (RTK) positioning is a high-precision geo-positioning method that uses satellite correction data to achieve centimeter-level accuracy in the right conditions. In utility locating, RTK ensures that mapped utility data is geospatially accurate, enabling precise excavation and long-term asset management.
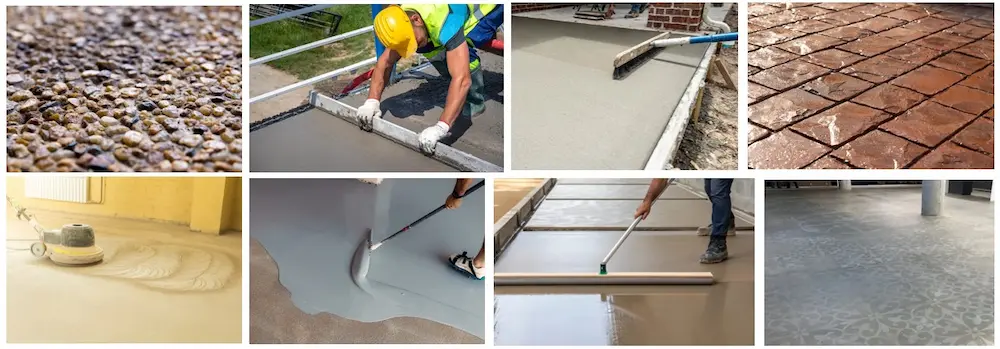
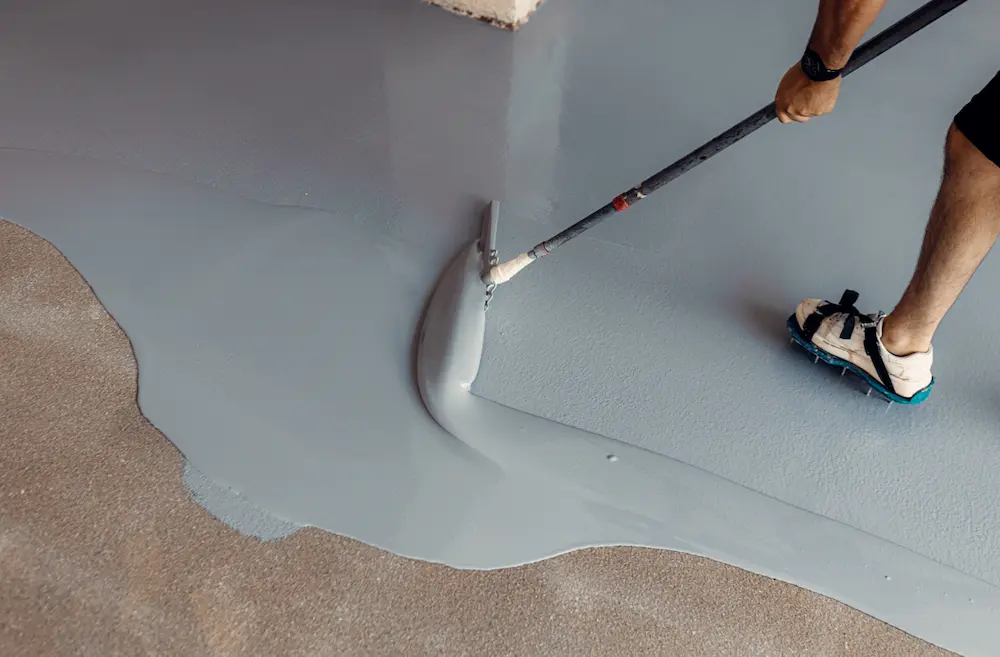
Concrete Finishes in Commercial Construction: Types, Processes, Curing, and Performance
Selecting the right concrete finish can impact safety, lifecycle performance, maintainability, and cost for any building, facility, or campus. For GCs, concrete subcontractors, and facilities managers, getting the means, methods, and timing right – especially finishing, jointing, and curing – determines whether a slab meets specifications like flatness/levelness, hardness, and appearance, while avoiding cracking, curl, dusting, and coating failures.
And understanding the various finish types, their maintenance, and repair needs allows facilities managers to effectively plan repairs, renovations, retooling, or any work that requires you to cut, core, or drill into your concrete.
You can use this quick-reference guide to help you determine the best finish for your job, plan for crew and equipment needs, set FF/FL expectations, schedule for saw cuts & cure times, validate slip resistance (DCOF) and moisture (ASTM F2170) requirements, and choose maintenance schedules that align with your facility’s use.
A. Cross Project Technical Fundamentals
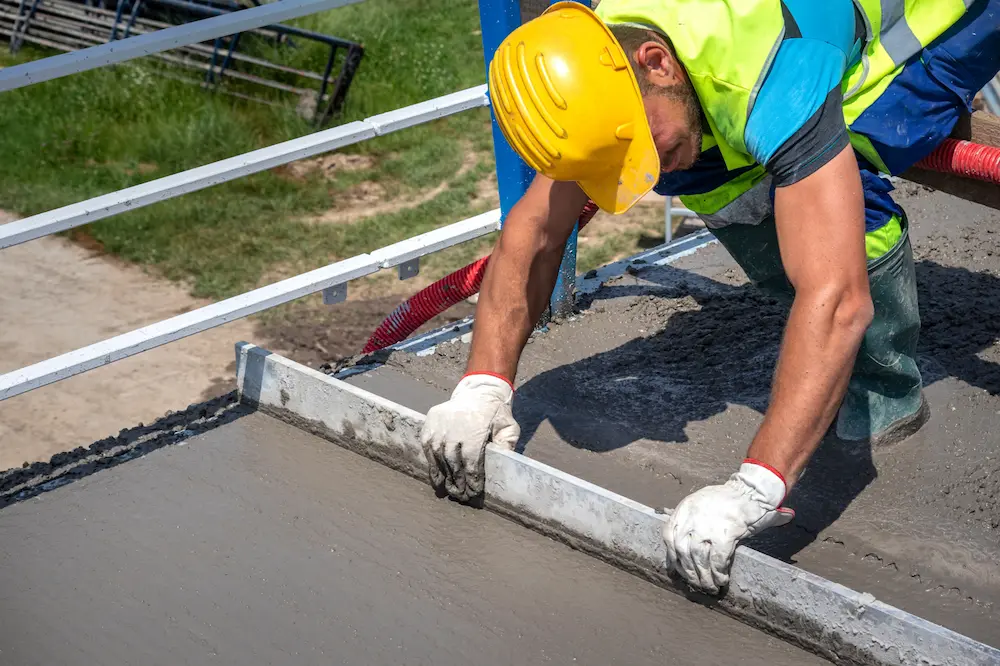
1) Placing → Finishing Window (the “don’t miss it” timeline)
- It’s important to remember not to begin finishing while bleed water is present. The timing of finishing, jointing, and curing is critical; poor timing can cause cracking, scaling, impact the concrete’s wear resistance, cause dusting, and increase the risk of curling. When scheduling, you’ll want to plan manpower, tools, and breaks by both the size of the pour and the overall environmental conditions.
- Jointing: sawcut as early as the slab can support the saw without raveling. The typical guidance for jointing is within 4–12 hours, depending on temperature (hot sooner, cold later) and reach ≥ 1/4 slab thickness (≥ 1 in. minimum). Some specifications call 1/3 depth where fiber reinforced mixes are used. Joint layout and spacing should be established on your drawings. The specs are commonly 24-36 × slab thickness, but should always be driven by the engineer of record.
2) Curing (strength, abrasion resistance, color uniformity)
- Follow ACI 308R for optimal cure times. You’ll need to maintain moisture and temperature to ensure correct hydration. Seven days is a common minimum for many mixes. Although it may be longer for blended cements, pozzolans, or in colder weather. You may also use the manufacturer’s coverage rates and expected coating compatibility as part of your calculations. Not allowing adequate cure times can reduce surface strength and increases the risk for dusting and scaling.
- Moisture sensitive flooring/coatings: Your curing method must be compatible with subsequent finishes. For example, certain curing compounds may require removal prior to coating. It’s important to verify the specific curing and coating needs via submittals for each variety of concrete that may be used.
3) Acceptance Strength, Early Age Indicators
- Acceptance is 28 day unless otherwise specified (ACI 318). 7 day results are for monitoring only, not acceptance. Typical field heuristics see approximately 65-70% of 28 day strength by day 7, depending on mix and ambient temperature. You should always rely on project specifications for acceptance.
4) Floor Flatness & Levelness (F Numbers)
- ASTM E1155 lays out the measuring requirements (FF for flatness, FL for levelness) and includes statistical sampling for random traffic floors. If you’re working with fixed path VNA (very narrow aisle) aisles, you will need direct path profilometry, rather than an E1155 random sampling. Coordinate the Specified Overall Values (SOV) and Minimum Local Values (MLV) in your specifications. Remember, E1155 computes values, it does not define sectioning or pass/fail criteria.
- Design guides typically illustrate common FF/FL ranges by use. For example, office/retail, or defined traffic aisles, but you want to use the appropriate guide specific to your project.
5) Slip Resistance / ADA / DCOF
- The Americans with Disabilities Act (the ADA) requires construction to include accessible surfaces that are firm, stable, and slip resistant, although there is no single DCOF (Dynamic Coefficient of Friction) mandated. It is important to select textures and finishes that are appropriate to likely conditions and potential contaminants.
- Polished concrete tested by CPC/TCNA showed DCOF ≥ 0.42 across multiple gloss levels using ANSI A137.1 / A326.3 methods—document target DCOF by area and condition (dry/wet).
6) Moisture Testing Prior to Coatings/Resilients
- For in-situ RH (relative humidity) probes, refer to ASTM F2170, which calls for three holes for first 1,000 s.f. and 1 hole per additional 1,000 s.f.. Then test at 40% depth for one sided dry concrete, or 20% depth for two sided dry concrete, after 48 hours at normal service conditions. Record and report your readings, and compare them to coating manufacturer’s RH limits.
B. Finish By Finish Technical Detail
Consider utilizing the following “process blocks” when planning and executing your finishes. We’ve broken them out for you on each type of finish as follows:
Prep/Place → Finish Steps → Joints/Curing → QA/QC → Cure/Use timing → Durability & Maintenance → Typical Uses
1) Troweled Finish (Steel Trowel/Burnished)
Process: Follow your strike off with a bull float. Allow any and all bleed water to evaporate fully. Densify the top pass with multiple steel trowel passes. Use power trowels for large bays. Uniform timing is vital to avoid dark/light burnish patching.
Joints/Curing: Layout joints per plans and perform early entry cuts when the raveling risk is low. Begin curing immediately: wet cure or compatible curing compound.
QA/QC: Monitor your finish window, avoid over troweling to reduce the chances for entrapped water and air that can lead to dusting, and check your FF/FL levels.
Cure/Use: Typically, your cure will be walkable on the next day, but will not sustain heavy rolling loads until after the full design strength and curing period have ended. Be sure to coordinate your cure times with any TI schedule. TI is an abbreviation for titanium dioxide – TiO2 – the substance often used as a photocatalyst in more sustainable concrete finishes and mixes.
Durability & Maintenance: You should achieve good abrasion resistance, if the concrete was cured and jointed correctly, with low wet traction. This means your facilities and operations managers should specify mats or surface treatments should this finish become wet.
Use Cases: Offices, retail, back-of-house dry areas. Be sure to set DCOF and safety expectations if this finish is exposed to wetness.
2) Float Finish (Mag/Wood Float)

Process: After your bull float, use a mag or wood float to open the paste and create a fine texture. This is often the intermediate step before steel troweling, or a final finish for traction.
Curing/QA: The same notes here as for the finish above. It’s important to watch your cure window, and check for texture uniformity across placements.
Performance: Float finishes generally provide higher traction than a plain steel troweled finish. Floats also retain modest amounts of soil over time, so they usually require a regular cleaning schedule to maintain their appearance and traction.
Use Cases: Exterior aprons, loading areas, or as a base for a broom finish
3) Broom Finish
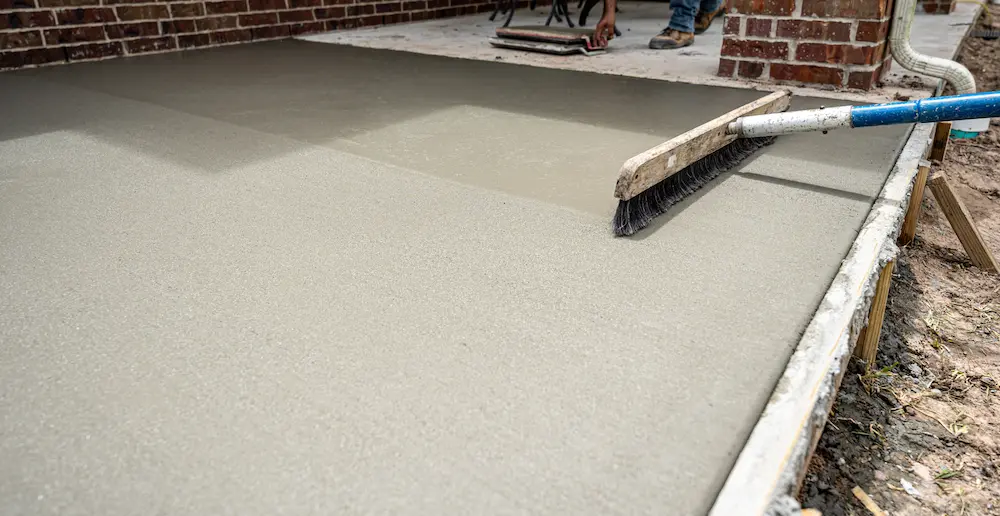
Process: While the surface is still “plastic,” draw a broom consistently – either in one direction or in a cross broom pattern, as specified in your plans – for ridged texture. You can control your ridge depth with the stiffness of your broom bristles and how you time consecutive passes.
Joints/Curing: Broom finishes generally go best when you joint early, then cure to lock in the paste and minimize scaling.
Safety/DCOF: Broom finishes are known for their excellent wet traction, which is why they are common for ADA routes and ramps when detailed properly.
Use Cases: Sidewalks, ramps, exterior paths, the walking surfaces of parking decks
4) Exposed Aggregate

Process: Place your concrete, then seed or use integrally mixed decorative aggregate over it. Utilize surface retarders or a timed wash to provide uniform aggregate exposure. It’s important to protect this finish from early drying to lock the aggregate features in place.
Curing: To minimize aggregate feature loss and staining, sealants/sealers are often recommended.
Performance: Exposed aggregate finishes are generally high traction and durable in bad weather. However, they can present navigation challenges for wheeled carts and items with small casters.
Use Cases: Plazas, hospitality exteriors, pool decks
5) Stamped Concrete

Process: Stamped concrete requires color hardeners and release agents that are applied via stamping mats during plastic stage, and a plan that details the joints to follow the stamped pattern’s logic.
Curing/Sealing: Whatever curing compound you use should be compatible with the ongoing need for periodic resealing to protect the color/pattern. When selecting additives, it is important to choose those with anti slip protections for wet zones.
Performance: While stamped concrete finishes are decorative, they still require joints and cracking control, as well as slip-resistance. That’s why it’s important to schedule regular reseal cycles that meet your traffic and UV conditions.
Use Cases: Retail streetscapes, restaurant patios, branded entries, mixed-use properties
6) Stenciled Concrete

Process: The process and care schedule for stenciled concrete is similar to stamping, but generally stenciling is best used in areas without high foot traffic. Process-wise, once you’ve hit an acceptable level of cure, place and set your stencils, add your color, hardener, and/or texture. Then remove the stencils, allow the concrete to complete its cure, and seal accordingly.
Performance: Stenciling is a more cost effective method than stamping to add patterns in areas that have light to moderate foot traffic. However, it is not often used with a strong texture, and it does require monitoring for colorfastness, and a regular schedule for resealing to maintain the pattern.
7) Polished Concrete
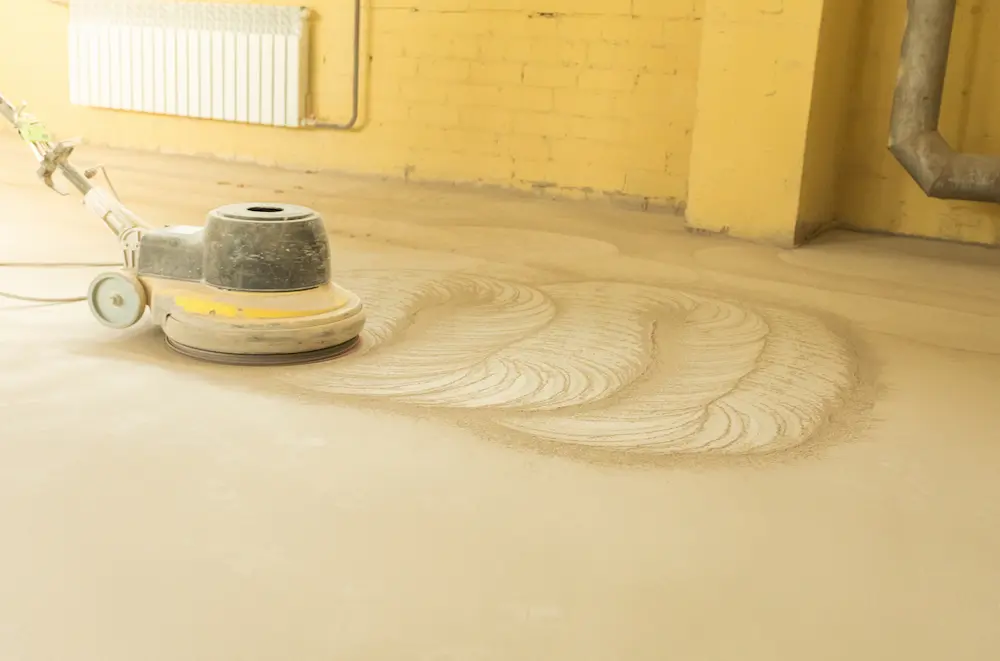
Process: This finish provides a high-gloss, slick look to your concrete. To achieve it requires 6-8 grinding and polishing steps at minimum. Grinding is most often an aggressive metal bond grind with a highly abrasive diamond-tipped head to smooth out rough spots and level the surface, followed by finer grinding in the transition phase to smooth the surface. A resin-bond grind following the initial grind will not usually do enough to fully polish the surface, so you may need to follow it with a ceramic or copper bond matrix polish, to tighten the pores in preparation for applying a densifier to fill in pores and creating a harder, wear-resistant finish. Refer to the specified CPC (Concrete Polishing Council/ASCC) class, aggregate exposure, and sheen when finishing and verify by DOI (Distinctness of Image), gloss, or haze metrics.
Slip Resistance: CPC and TCNA (Tile Council of North America) testing showed a DCOF ≥ 0.42 across finishes, which is in keeping with ANSI’s A326.3 requirements for interior, wet areas like bathrooms, kitchens, lobbies, and large retail stores like supermarkets. Due to its high gloss, it is crucial to document all target metrics and cleaning regimen schedules because gloss alone cannot predict slip; contaminants and maintenance have a huge impact on it.
Energy/ESG: The highly reflective surface of polished concrete can reduce lighting energy needs, and concrete’s thermal mass can help moderate indoor temperatures, which support energy performance and LEED strategies, when included as part of a whole building design.
Curing/Timing: Due to the aggressive nature of the initial grind stages, you need to allow for 28 days of cure, on average before grinding, depending on the project needs. If you need to polish early to keep to schedule, a best practice is to utilize contractor submittals to document risks and mitigations.
Maintenance: After its initial labor-intensive finish, polished concrete can be one of the easiest to maintain. Often a dust mop and periodic autoscrubbing can handle cleaning, as long as you avoid film forming sealers that can mask or impact your refinement metrics. You will also need to schedule periodic re polishes for higher traffic lanes.
Use Cases: Warehouses, big box retailers, showrooms, offices, schools
8) Epoxy Coatings: 100% Solids, Waterborne Systems, High Chemical/Novolac
Epoxy finishes and coatings vary greatly depending on the use case. Durability, resistance to chemicals, and the environment during application can all play a role. Heavy duty protection often requires 100% solid epoxy, less high-traffic/high-stress use cases may be able to make use of waterborne systems, while areas that will endure extreme chemical exposure, like labs, chemical processing facilities, or battery recharging rooms will likely need Novolac.
Substrate Preparation: Decide on the necessary CSP (Concrete Surface Profile) and proceed with grinding or shot blasting to achieve the required roughness level. Verify the relative humidity (RH) level needs via both ASTM F2170 and the manufacturer requirements before treating, and remove any potentially incompatible curing compounds.
Build & Film Thickness: Most common epoxy systems provide a thin-mil or thin-film coating of 10–30 mils. Broadcast/quartz (distributed aggregate) and mortar systems (filler sand or aggregate) will be thicker by necessity. Your build and thickness requirements will depend on traffic needs, the level of chemicals to which the finish may be exposed, and thermal cycling.
Chemistry: Bis A, Bis F, and Novolac systems vary in their levels of chemical and temperature resistance. Determining your choice of hardener: polyamide, amine, cycloaliphatic, or phenalkamine, can tune your cure speed, blush, and chemical resistance.
Cure & Recoat Windows: Many 100% solids systems are tack-free at around 3-8 hours at a steady temperature of 70°F. In general, you can recoat anywhere from 3 hours to 14 days after your initial coat. Light traffic areas can be ready in as little as 24 hours, while areas requiring full chemical resistance will take 3-7 days, depending on the ambient temperature during cure. It is important to verify these times via your product’s data sheet.
Industrial Duty: Epoxy finishes are desirable in areas that need high chemical and abrasion resistance. Novolac is the most-often suggested epoxy for areas where strong acids and/or solvents are used, in secondary containment areas and process trenches, for example.
Use Cases: Manufacturing, pharma/healthcare, food & beverage manufacture, commercial kitchens, laboratories
C. Curing, Moisture, and Timing: What You Need to Schedule
Recommended Curing & Use Milestones in Typical Ranges.
(Always verify your specifications and product data.)
- Concrete curing: It is important to maintain moisture for your wet cure or curing compound per ACI 308R. Many mixes say they need 7 days. The cure period could be more for a moist cure, so check specifications because early drying elevates your risk for dusting and scaling.
- Sawcut: You can often cut somewhere between 4 and 12 hours after placement depending on conditions with a depth at 1/4 slab or more (≥ 1 in. minimum). You’ll want to coordinate any early entry saw cuts to minimize raveling.
- Moisture testing: Conduct ASTM F2170 at your regular service conditions. While you can insert a probe as early as 24 hours post-finish, the industry standard is to allow 48 hours of cure/conditioning period before testing. The necessary probe hole depth is 40% for one-sided, or 20% for two-sided slabs, with 3 holes per the first 1,000 s.f. and1 hole per each 1,000 s.f. thereafter. Be sure to compare your desired results to the manufacturer’s RH limits before installing epoxies.
- Epoxy coating service: Your finish can usually sustain light foot traffic in under 24 hours at an ambient conditioning temperature of 70°F. Surfaces requiring heavy or chemical exposure can be used once the full cure is reached, usually in 3-7 days. When recoating, your window could be a few hours to several days, depending on the finishes’ chemistry and the ambient temperature.
- Polish start: Industry standards prefer at least a 28-day cure period before a full grind or polish, unless early polish plan is approved.
D. Durability, Performance & Safety: What the Data Says
- Your finish choice impacts abrasion resistance and maintenance schedules: Inadequate curing/finishing can lead to dusting and early wear. Allowing enough time for proper curing elevates surface hardness and creates a longer-lasting finish.
- Polished concrete can reduce energy use via reflectivity and has been shown to moderate HVAC loads via thermal mass. However, these benefits are only when your concrete finishes are integrated with the lighting and HVAC designs and maintenance schedules.
- Slip resistance is context sensitive and can depend on a wide number of variables like contaminants, footwear, slope, and maintenance, among others. The ADA stops short of prescribing a single COF, so it’s a good idea to document surface conditions and cleaning schedules in O&M manuals.
- CPC/TCNA DCOF testing found polished concrete sections exceeded 0.42 even at high gloss, making them safe for high-traffic, wet areas. However, gloss ≠ safety. Soiling, cleaning routines, and spill management can all impact slip.
- Epoxy systems can achieve high chemical and abrasion resistance. Novolac resins can extend acid resistance, but you must confirm compatibility and the specific recoat and cure windows to avoid amine blush or intercoat adhesion issues.
E. Market & Usage Snapshot (context for owner conversations)
- The decorative concrete market, which includes polished, stamped and overlay finishes, is estimated at just under $19.5B in 2025, with an approximate 5-6% CAGR future-cast into 2030–2037 across analyses. These numbers reflect continuing and sustained demand in nonresidential and commercial upgrades and low maintenance finish needs.
F. Submittal Language & QA/QC Checklists
Here are some quick submittal language specifications and QA/QC checklists that you might be able to make use of for your concrete finishing work.
1) General Slab & Finish Submittals
- Mix design with SCMs, water cement ratio, admixtures; target strengths and shrinkage data. (Acceptance at 28 days per ACI 318 unless noted.)
- Finishing plan: manpower, equipment (screeds, pans, power trowels), placement map, FF/FL targets and test plan per ASTM E1155 (SOV & MLV defined in spec).
- Joint layout (spacing, depth, timing, filler type; early entry saw plan)
- Curing plan per ACI 308R (method, duration, compatibility with coatings)
- Moisture testing plan: ASTM F2170 method, hole depths/locations, service conditions confirmation, manufacturer RH thresholds
2) Finish Specific QA
- Polished Concrete: Specify CPC Aggregate Class (A–D) and Appearance/Gloss Level (1–4); require DOI/gloss/haze verification before any topical guards. Include DCOF target by area/use
- Epoxy Coatings: Substrate CSP, RH % (F2170), primer/system thickness, recoat window, cure schedule, chemical resistance tables (if labs/process)
- Exterior textured finishes (broom/exposed/stamped): State slip resistance expectations and sealer maintenance intervals
G. Quick Reference Tables
Table 1 – Processes, Timing, and Curing (selected highlights)
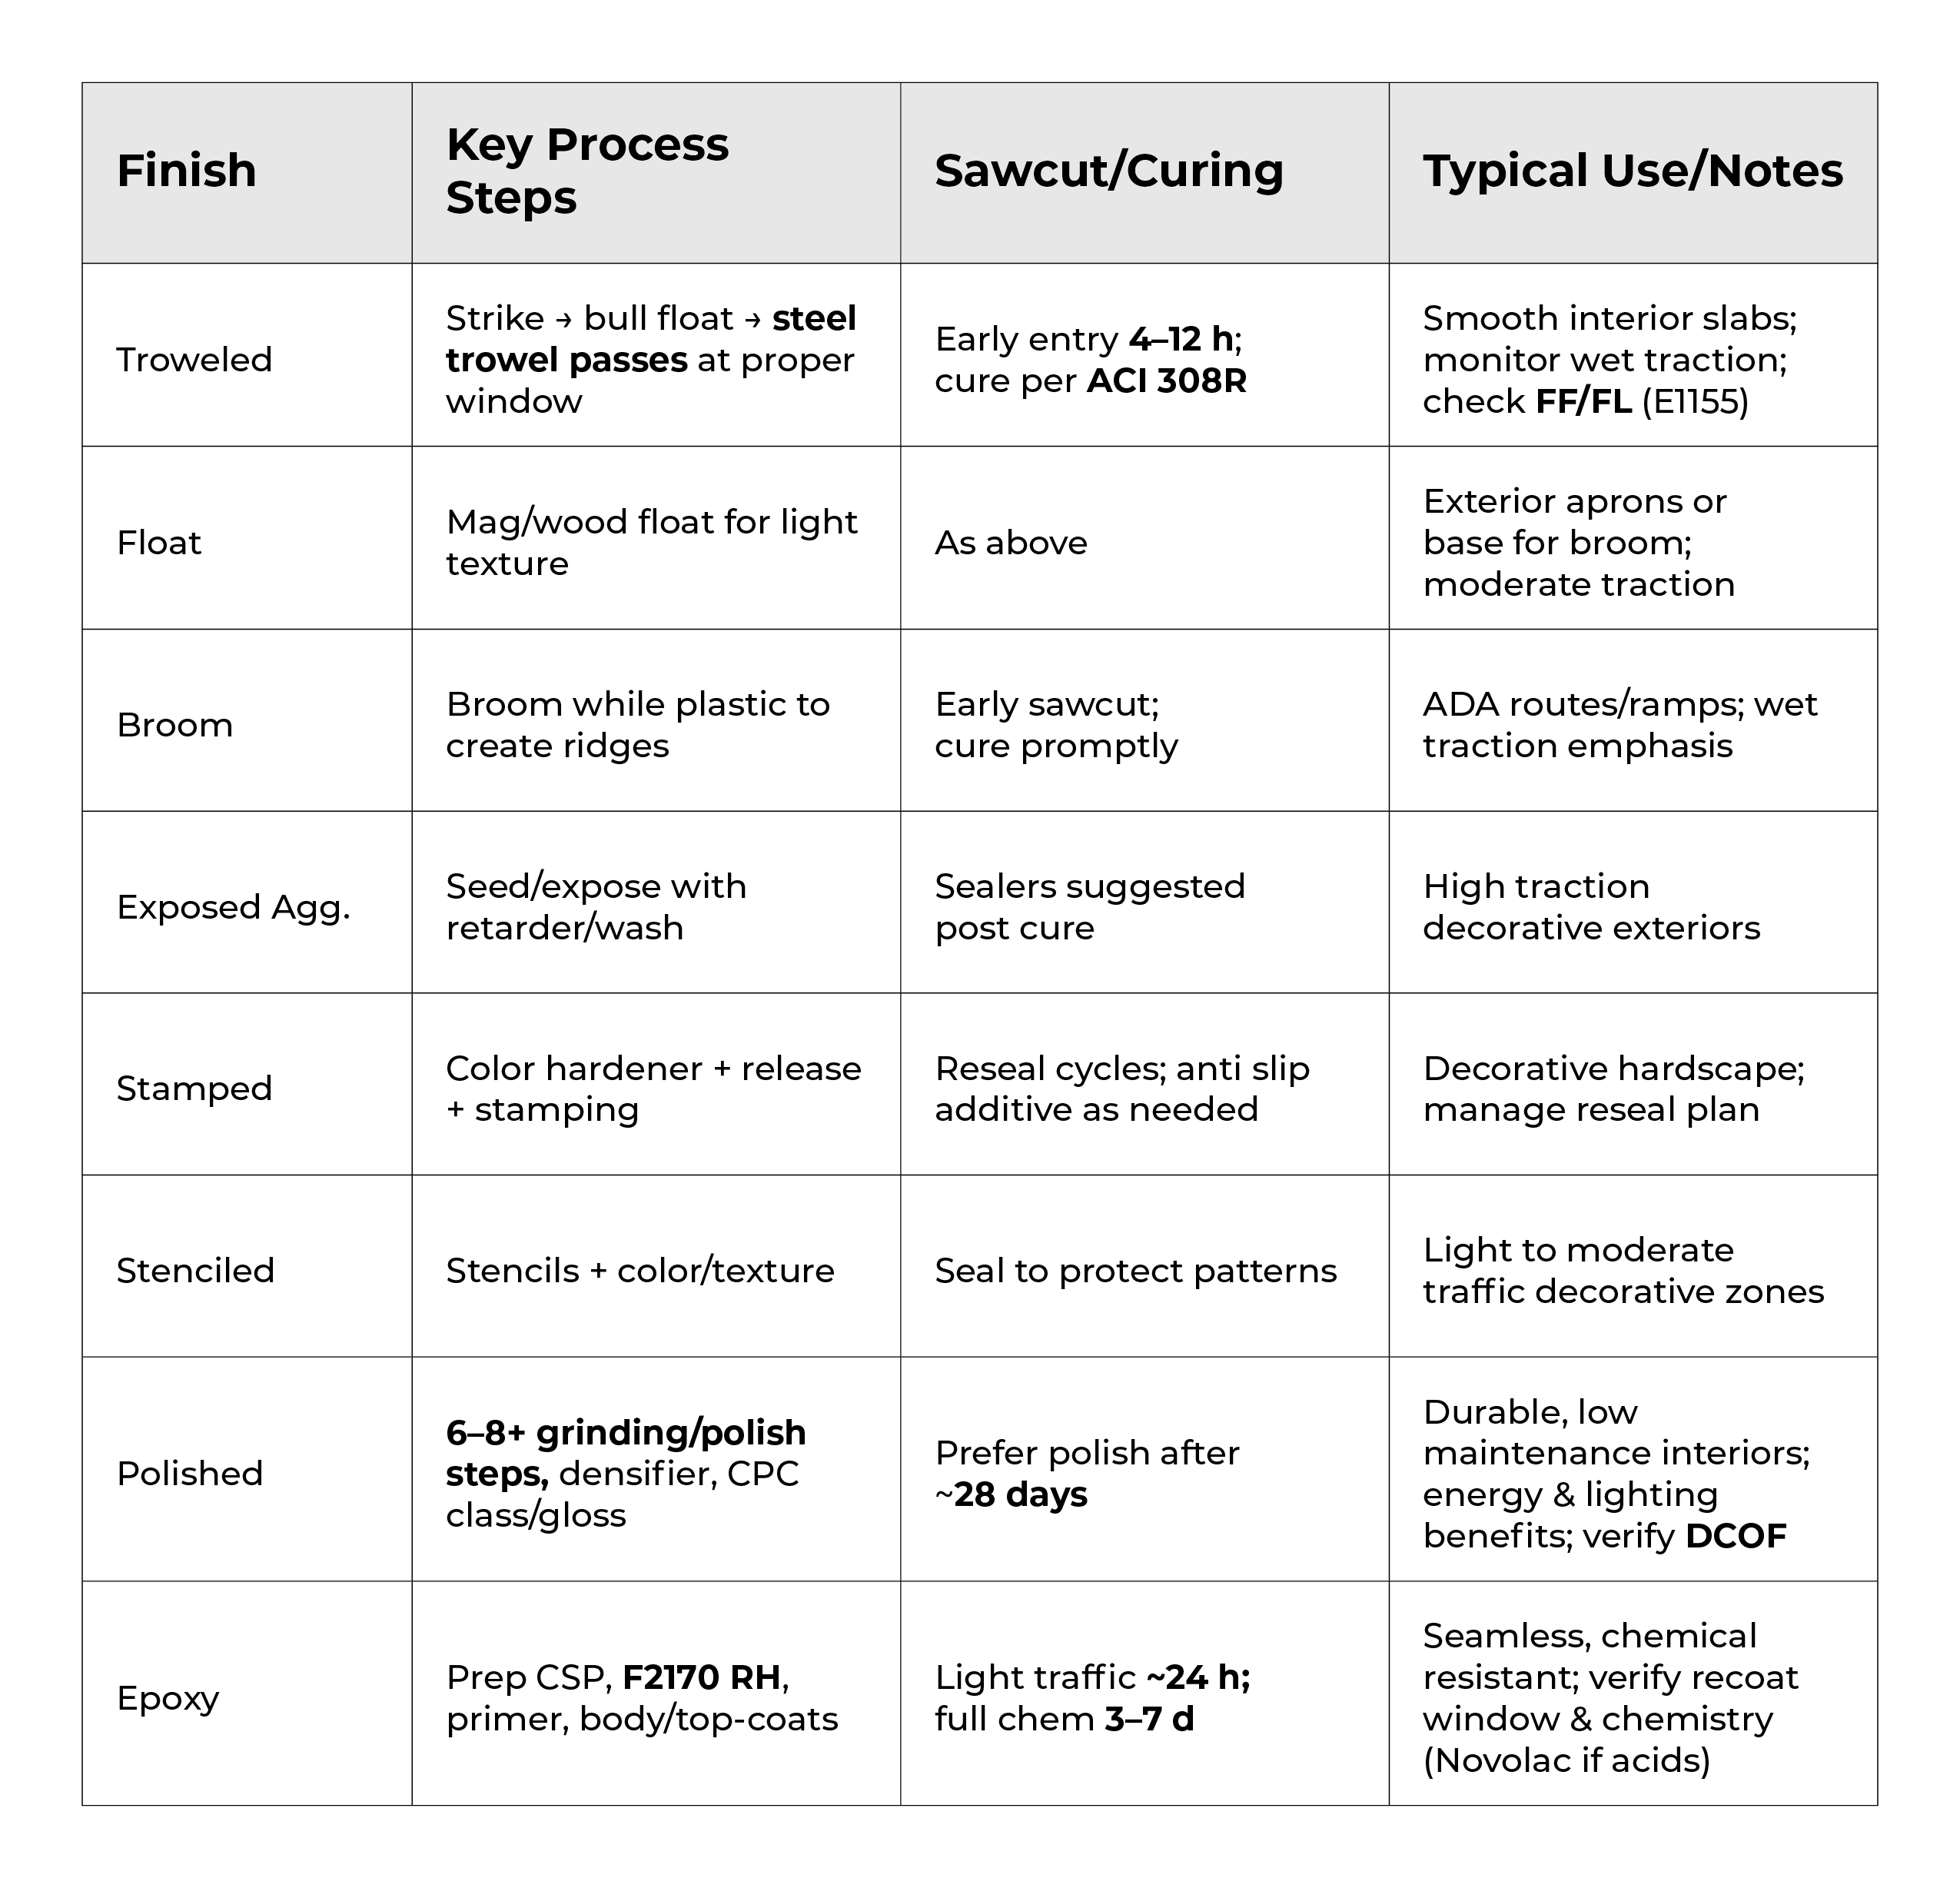
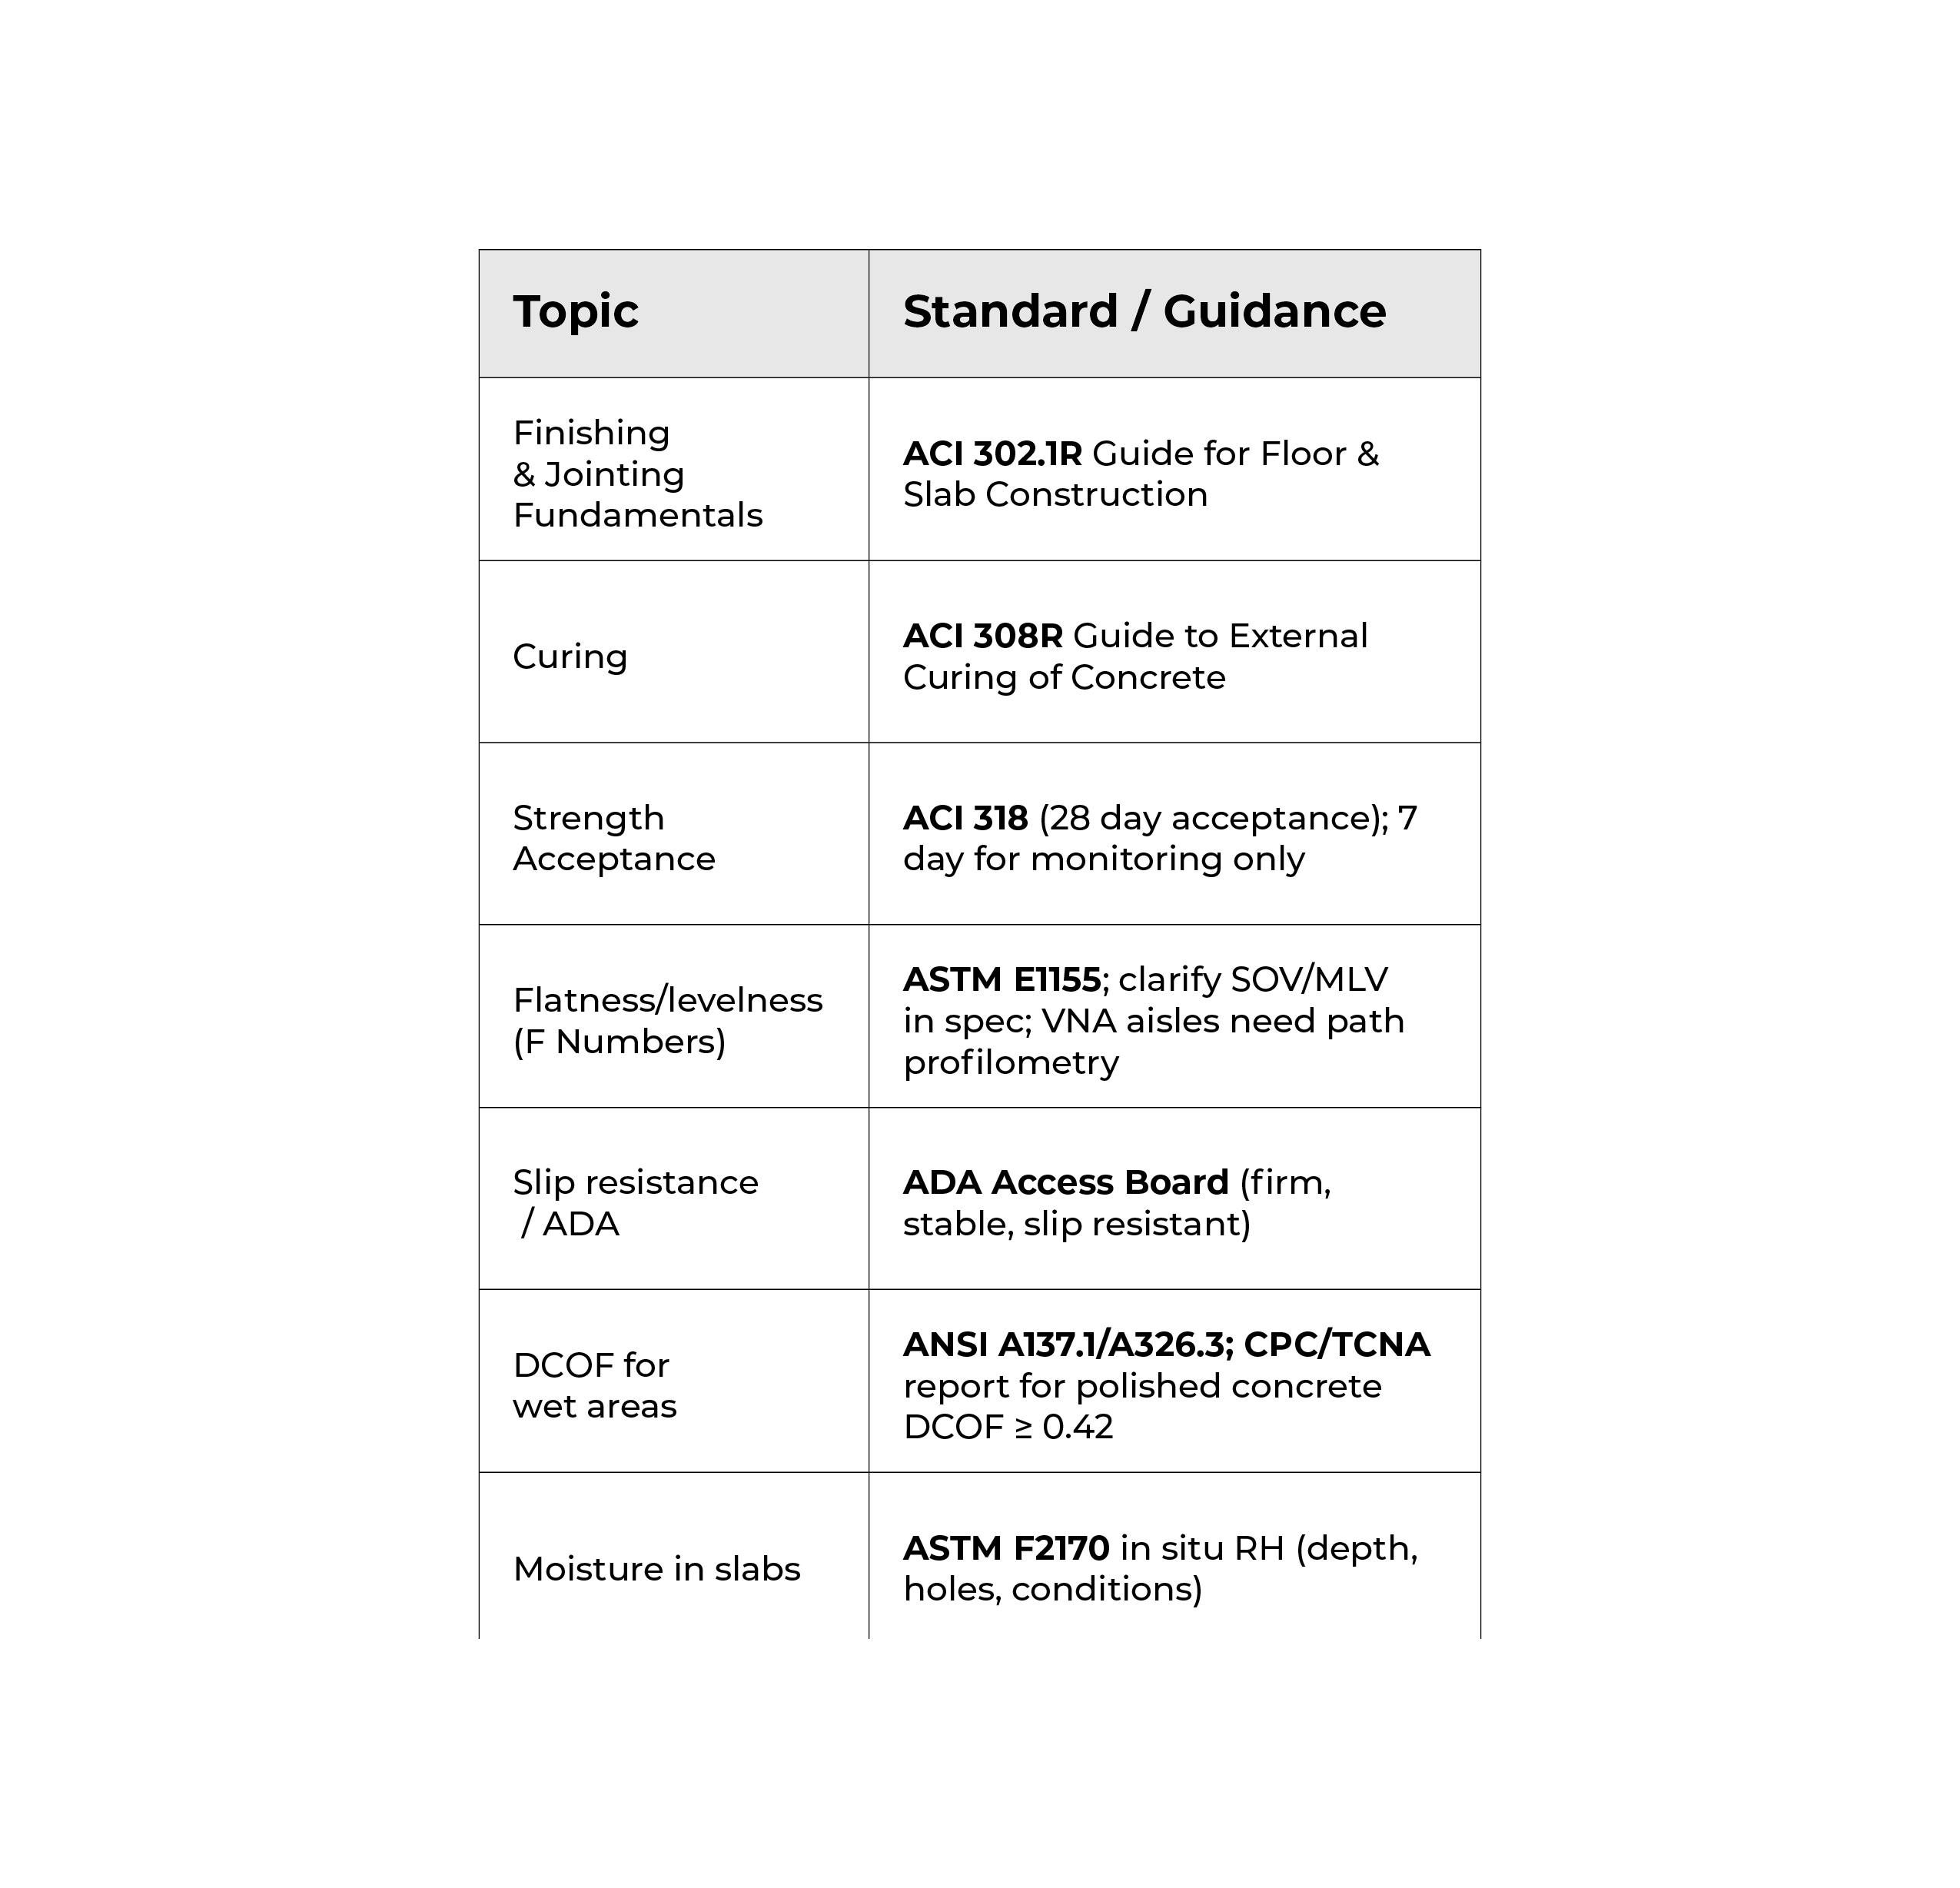
Table 2 – Standards & Tests to Reference
H. Decision Matrix: Matching Finish to Facility Demands
- Heavy forklift traffic / low maintenance → Polished concrete (spec CPC class/level; protect from oils with penetrants as needed; document cleaning program) and/or epoxy mortar/quartz in impact/chemical zones
- Food, healthcare, labs → Epoxy/Novolac systems with coves, slope-to-drain, and documented RH compliance (F2170)
- Exterior pedestrian safety → Broom or exposed aggregate (ADA emphasis) with UV-stable sealer plan
- Branding/streetscape → Stamped/stenciled, with reseal budget and anti-slip additives where wet
I. Common Pitfalls & How to Avoid Them
1. Finishing too early (over bleed water) → weak, dusty surface. Train crews to wait for the right window; mockups help
2. Late saw cuts → random cracking. Staff early-entry saw crew or adjust pour sizes/logistics
3. Incompatible curing when coatings planned → remove film-forming compounds or select compatible systems; coordinate early with coating sub
4. Skipping RH testing → coating delamination/OSD. Always test per ASTM F2170 and document
5. Mis-specifying FF/FL → claims and grinding. Write SOV/MLV and paths (for VNA), not just “per E1155”
6. Assuming gloss = safe → specify DCOF targets, cleaning, and mats in wet zones
7. Conduct comprehensive concrete scanning & imaging before cutting, coring or drilling into finished and cured concrete slabs. Finishes can be repaired in a variety of ways once you've pierced the surface, but your repair costs will skyrocket if your saw cut or anchor core strikes a post tension cable, conduit, or concrete reinforcement. In the case of outdoor concrete finishes and slabs, you may also strike underground utilities that could include gas lines, water mains, telecommunication lines, electrical transmission lines, and more, which could further hinder work progress and lead to cost overruns. Hiring a private concrete scanning and utility locating company like GPRS to visualize what’s inside and under your finished concrete can save labor hours, dollars, and can help keep your contractors, subs, and team members safe.
GPRS Visualizes The Built World® for customers throughout the U.S. What can we help you visualize?
What is the Future of 3D Laser Scanning?
The way we design, build, and manage spaces is changing fast. Technologies like 3D laser scanning, digital twins, and virtual tours are no longer just buzzwords. They’re critical tools for the project lifecycle. These solutions help capture real-world conditions with precision, reduce risk, and improve decision-making.
As Matt Mikolajczyk, GPRS Director of Reality Capture Services, explains, “Laser scanning should go beyond line of sight by adding context, like rebar thickness, concrete depth, and conduit placement under the slab, the thickness of walls, adding an extra layer of attribute data.”
This means capturing details from both above and below-ground, which helps create a complete picture for every stage of a project. The future of reality capture goes beyond what you can see.
How Does 3D Laser Scanning Work?
A 3D laser scanner is a powerful tool. It measures and maps spaces with construction-grade accuracy. The laser pulses off surfaces and return to the scanner’s sensor, a process known as Light Detection and Ranging (LiDAR). The scanner measures the time between each outgoing and incoming pulse to calculate the exact distance to the object. Each pulse produces a data point with a known X, Y, and Z coordinate.
To capture a complete view of a site, the scanner records data from different viewpoints. The scanner collects millions of individual points, which form a point cloud to create a precise 3D as-built data set of the site.
LiDAR-based scanners get speeds of up to two million points per second and maintain accuracy within 2-4 millimeters. This level of performance allows the Project Manager to document complex environments quickly.
What is the Current Market Landscape?
Future Market Insights, Inc. states, “From 2020 to 2024, the 3D scanning market grew from USD 3.3 billion to USD 5.1 billion, driven by hardware-centric adoption.” During this time, equipment manufacturers drove about 70% of revenue, including Hexagon AB, FARO, and Creaform.
Accuracy, speed, and cost-effectiveness were competitive attributes. Demand for 3D laser scanning will continue to increase this year and will expand to $16.66 billion by 2030. Laser scanning technology has made big strides, enhancing resolution and real-time processing power.
Here is how the architectural, engineering, and construction industries leverage 3D laser scanning:
- Architects utilize 3D laser scanning services to save valuable time and money and make informed decisions. An inaccurate set of as-builts leads to major cost overruns and delays. 3D laser scanning streamlines their workflows. This helps them skip time-consuming manual measurements and focus on their designs.
- Engineers need reliable existing conditions documentation to design upgrades or modifications with confidence. Inaccurate as-built documentation introduces errors that disrupt engineering workflows and cause costly delays. Engineers use 3D laser scanning its fast and precise measurements.
- Builders and general contractors need accurate as-built documentation because it helps them meet design specs, fix on-site problems, and keep projects on track. Accurate as-built drawings and BIM models are then created from 3D point clouds. These deliverables help with renovation planning and construction sequencing. They support important project decisions.
The AEC industries use 3D laser scanning the most. Yet, many other industries also use this technology. The entertainment industry uses scan data to create lifelike virtual worlds. Police departments use it to recreate crime scenes and improve investigations. Scientists use scan data to better comprehend the world and track environmental changes. Archaeologists use it to analyze and learn about artifacts. It reveals details that older tools couldn’t show.
How is 3D Laser Scanning Evolving?
History of 3D Laser Scanning
Before the introduction of 3D laser scanning, building industry professionals relied on manual methods to create building drawings. Surveyors and draftsmen used tape measures and levels to measure sites by hand. They sketched layouts in field notebooks. Then, they used graph paper and drafting tools to produce scaled drawings.
Blueprint machines made the final versions. The blueprints were kept in physical archives and shared with architects, engineers, and contractors. This process often caused errors, especially in hard-to-reach areas. It also took a lot of time and effort to finish.
RELATED ARTICLE: Read more about The History of 3D Laser Scanning
The Use of Simultaneous Localization and Mapping (SLAM) Technology
3D laser scanning is changing fast. One big change is the use of Simultaneous Localization and Mapping (SLAM) technology.
According to FARO, "It is the process of mapping an area while keeping track of the location of the device within that area. This is what makes mobile mapping possible, allowing the digitization of large areas in much shorter spaces of time."
This dual capability is very helpful in changing situations or places without GPS. Examples of these spaces and projects include underground tunnels, crowded cities, or disaster areas.
.webp)
GPS signals can’t reach underground mines. So, SLAM-equipped robots navigate tunnels on their own, and also create high-resolution maps.
In construction, handheld SLAM devices collect spatial data in hard-to-access areas without compromising data quality. SLAM plays a key role in today's reality capture workflows because it is crucial for working in complex areas without GPS.
LiDAR in Combination with SLAM Technology
Using terrestrial laser scanning (TLS) with SLAM-based mobile mapping improves accuracy and eliminates drift. TLS sets fixed control points that lock the scan data in place. SLAM scanners then cover areas that are hard to reach or lack GPS signals. Together, they create a complete and accurate map of the site. SLAM uses control points and loop closures to correct drift and reach high-precision results.
What is Above and Below-Ground 3D Capture?
As scanning technologies advance, so does the expectation for complete site visualization. Today's reality capture deliverables reveal what’s hidden beneath the surface. By combining 3D laser scanning with subsurface locating technologies, project teams can gain a holistic view of both structural and underground conditions. This dual-layered approach reduces risk, improves planning accuracy, and supports informed decision-making throughout the project lifecycle.
.jpg)
GPRS provides a variety of services to give you complete site and facility visualization, both above and below-ground.
We are a national service provider for 3D laser scanning, utility locating, concrete scanning, video pipe inspection, and leak detection. The combination of these services can provide your company with accurate data of existing as-built conditions and subsurface information.
You can receive clear and understandable findings of structural, MEP, and field markings in custom deliverables such as point clouds, 2D as-builts, and 3D models. Accurate data allows our clients to expedite design planning, extract 3D coordinates and measure distances, along with the ability to mark up and share this across project teams. Receiving critical site information can reduce your project risks and expand project efficiency.
What is the Role of AI and Machine Learning Reality Capture?
AI is growing in many industries. It improves 3D laser scanning systems' capabilities. These technologies support greater accuracy, faster decision-making, and streamlined workflows.
Artificial Intelligence
According to AVEVA, artificial intelligence is beginning to play an important role in optimizing point cloud processing. Point cloud datasets are very large, making manual processing time intensive. Point cloud processing involves several technical steps:
- Segmentation
- Object Detection
- Classification
- Feature Extraction
- Error Filtering
AI is starting to make this process easier by automating some of these steps, which can save time and provide a scalable solution. Some experts believe AI could enhance laser scanning even further as the technology improves.
AI is starting to play a bigger role in many industries. It can help with simple tasks, like sorting parts, and more complex ones, like identifying machines in a factory. Some experts say this can automate work and help answer questions like “How many machines do we have?” or “How can we improve this process?” These tools are growing quickly because of cloud computing and deep learning.
However, others are more cautious. If something goes wrong, it’s hard to review the AI’s work. Without a trained Project Manager reviewing the scan data, mistakes could go unnoticed. AI is still unproven in some areas, and removing the human factor can a risk factor. Project Managers still need to understand how the equipment works and what the client needs. Relying on AI alone could lead to errors that are hard to explain to the client.
Some software has AI features like recognition tools and automatic line extraction. But these tools are not perfect yet. Industry experts like Michael Harvey, Reality Capture Product Manager at Leica Geosystems, believe AI will continue to evolve and impact workflows.
“AI is going to allow sensors to think a lot faster and provide answers to complex problems quicker. AI is not just the point cloud, but it is going to be applied to imagery,” said Harvey on the Reality Capture Network Podcast.
He also noted that this means we’ll need tools to clean up faces and license plates in images.
Machine Learning
Recent advances in machine learning show strong potential for automating the processing of point clouds to create accurate as-built models. These models are key for tasks in construction and infrastructure. It will help with progress tracking and quality checks.
.webp)
Computer vision is a part of artificial intelligence (AI) that helps computers “see” and understand pictures, videos, and other visual information. This technology works with machine learning. It helps systems spot patterns and features in data. It has already proven in areas like image recognition and voice processing. But using it for point clouds in construction is much more complex.
Point clouds are irregular, unordered, and unstructured, which makes it tough for algorithms to learn. On top of that, construction sites add a lot of noise, reducing accuracy and reliability. Even so, new machine learning tools are improving.
Visualizing the Built World®: Above and Below-Ground
The future of 3D laser scanning is clear: smarter, faster, and more connected. Combined with advanced LiDAR, SLAM technology, ground-penetrating radar (GPR), electromagnetic (EM) locating, and more, these tools deliver context-rich models that show what’s visible above ground and what’s hidden below.
.webp)
.webp)
Every project is unique, so we select the right tools and partner with you every step of the way. This isn’t just innovation, it’s the new standard to keep your projects running on time, on budget, and safe.
GPRS 3D Reality Capture Services
GPRS is a leading 3D laser scanning company in the United States, helping clients to successfully complete their most complex architecture, engineering, and construction projects. We've been providing reality capture services and excellent customer service for over two decades.
GPRS’ elite team of Project Managers efficiently 3D laser scans the exterior and interior of each site with professional-grade laser scanners, capturing the exact layout, dimensions, and locations of your specific project requirements, such as architectural, structural, and MEP features, walls, windows, doors, stairs, roof, railings, exposed columns, beams, equipment, piping, ducts, and more.
Our Mapping & Modeling Team registers and processes the point cloud, removing noise and setting the coordinate system to provide the most precise measurements. Data is then compiled into custom 2D CAD drawings and 3D BIM models and delivered via SiteMap®. SiteMap is GPRS’ secure GIS platform that delivers point cloud data, 2D CAD drawings, and 3D BIM models, giving clients 24/7 access to verified as-built documentation to help start accurate and stay accurate.
What can we help you visualize?
FREQUENTLY ASKED QUESTIONS
How will 3D laser scanning evolve beyond what we see today?
Point clouds, which are currently massive collections of X, Y, and Z coordinates, will become smart datasets that AI can interpret automatically. Future workflows will leverage AI to classify doors, windows, and exact machines in manufacturing. Cloud computing and deep learning make these capabilities possible, and they’re improving every day.
Why is 3D laser scanning important in modern construction?
It delivers precise, real-world data that supports design, renovation, and facility management, minimizing errors, saving time, and enhancing collaboration across trades through tools like Building Information Modeling (BIM).
What are the benefits of 3D laser scanning?
- Fast, Accurate Data Collection: A single laser scan captures millions of 3D data points per second, delivering highly detailed and precise representations of buildings. These dimensionally accurate, measurable, and shareable datasets streamline project collaboration.
- Eliminates Revisits and Minimizes Disruption: Comprehensive site capture on the first visit eliminates the need for return trips. High-speed data collection ensures projects move forward quickly with minimal disruption.
- Reduces Costs and Change Orders: Accurate design plans from the start streamline fieldwork, reducing costly change orders, delays, and unexpected expenses.
- Safe and Non-Contact: 3D laser scanners operate from a distance, even in hard-to-reach or hazardous areas, keeping workers safe. Its non-intrusive nature helps to preserve historic sites and delicate artifacts.
- Enhances Communication: With access to the same detailed information, project teams can collaborate more effectively, creating a dynamic working environment.
Why Wastewater Infrastructure Inspections Are Critical Before Property Acquisition
When you’re looking to buy residential, commercial, or industrial property, it’s easy to only pay attention to what you can see.
You inspect the structure’s condition, its location, and aesthetics. You look for cracks in the ceiling, broken windowpanes, and anything else you’ll need to fix.
But beneath the surface lies critical infrastructure that, if neglected, can have significant financial, environmental, and legal consequences.
Wastewater systems are essential to the health and functionality of any property. Inspecting sewer lines and related systems before buying a property isn’t just smart - it’s essential.
The Hidden Complexity of Wastewater Systems
Wastewater infrastructure is often out of sight, and consequently, out of mind.
Wastewater system issues aren't always easy to see, unlike a cracked foundation or a leaking roof. That’s a problem, because the condition of sewer lines and laterals can vary widely depending on age, usage, maintenance history, and environmental factors.
A property can look perfect on the outside. But it might hide problems like corroded sewer lines, overloaded septic systems, or poorly connected drainage networks. Without a professional inspection, these issues can remain undetected until they cause backups, contamination, or costly repairs.
Financial Implications of Neglect
A key reason to inspect wastewater infrastructure is the possible financial impact. Repairing or replacing wastewater systems can be prohibitively expensive. Sewer line replacements, especially in urban areas, may require excavation, permits, and coordination with municipal services, driving costs even higher.
If problems arise after acquisition, the buyer may have limited recourse. Many property deals have clauses that limit liability for hidden defects. This applies unless those defects were disclosed or found during due diligence. A thorough inspection helps buyers dodge surprise costs. It also lets them negotiate fair terms based on the real condition of the system.
Environmental and Health Risks
Engineers design wastewater systems to safely transport and treat sewage and graywater.
When these systems fail, the consequences can be severe. A broken sewer line can pollute soil, groundwater, and nearby water. This poses risks to both human health and the environment.
Contaminated water can carry pathogens such as E. coli, hepatitis, and other harmful bacteria and viruses. Exposure to these contaminants can lead to serious illness, especially in vulnerable populations. Wastewater leaks can harm the environment. This may lead to fines, cleanup costs, and damage to reputation, especially for businesses or factories.
An inspection ensures that the system complies with environmental regulations and functions as intended, protecting both the buyer and the broader community.
Regulatory Compliance and Legal Liability
Wastewater infrastructure is subject to a range of local, state, and federal regulations. These rules govern everything from system design and installation to maintenance and discharge limits. Noncompliance can result in legal liability, fines, and enforcement actions.
Properties with old or unapproved septic systems may need to upgrade or replace them to meet current standards. In some jurisdictions, properties must connect to municipal sewer systems if available, which can involve significant costs and logistical challenges.
A professional inspection can spot compliance issues before the deal is done. This helps buyers understand the legal landscape and plan ahead. It also offers helpful documents for negotiating repairs, upgrades, or price changes with the seller.
Impact on Property Value and Usability
The condition of wastewater infrastructure directly affects a property’s value and usability.
A malfunctioning system can limit occupancy, restrict development potential, or even render the property uninhabitable. For commercial properties, wastewater capacity may determine the feasibility of certain operations, such as food service, manufacturing, or hospitality.
Buyers should think about the system's current state and its ability to meet future needs. An inspection shows whether the system is the right size, well maintained, and ready for any planned changes or expansions.
In competitive markets, properties with well-maintained and compliant wastewater systems may command higher prices and attract more interest. Properties with unresolved issues may stay on the market longer or sell for less.
Due Diligence and Risk Management
Conducting a wastewater infrastructure inspection is a key component of due diligence. It demonstrates a proactive approach to risk management and helps buyers make informed decisions. By identifying potential problems early, buyers can:
- Request repairs or upgrades before closing
- Renegotiate the purchase price
- Allocate budget for future maintenance
- Avoid legal disputes and environmental liabilities
Due diligence is key for investors, developers, and businesses. It helps them when buying properties for income or redevelopment. Stakeholders need to consider a property's physical state, its operational viability, and its regulatory standing.
What a Comprehensive Inspection Includes
A thorough wastewater infrastructure inspection typically involves several components:
- Visual Inspection: Assessment of visible elements such as access points, tanks, and drainage fields
- Camera Inspection: Use of specialized cameras to inspect underground pipes for blockages, cracks, root intrusion, and other issues
- Flow Testing: Evaluation of system performance under normal and peak usage conditions
- Permit and Record Review: Examination of historical permits, maintenance records, and compliance documentation
- Soil and Water Testing: Analysis of surrounding soil and water for signs of contamination or system failure
Licensed professionals with experience in wastewater systems should conduct these inspections. Collaboration with environmental consultants or municipal authorities may be necessary to obtain a complete picture of your system.
GPRS offers NASSCO-certified video pipe inspections and other sewer inspection services designed to provide you with accurate, actionable data about your wastewater infrastructure. Utilizing remote-controlled sewer inspection crawlers and push-fed sewer scopes equipped with sondes, we map your sewer system while we’re inspecting it for defects such as inflow/infiltration (I/I) and cross bores.
All this data is at you and your team’s fingertips 24/7 thanks to SiteMap® (patent pending), our innovative infrastructure, facilities, and construction project management software application. Securely accessible via any computer, tablet or smartphone, SiteMap allows you and your team to plan, manage, and build better whether you’re together on-site or scattered across the country.
SiteMap Sewer Layer offers facilities managers precise, accessible, and actionable sewer mapping data. This innovation enhances everything from daily operational efficiency to risk mitigation and long-term asset maintenance planning by providing a centralized, single source of truth for sewer systems.
Case Study: GPRS Eliminates Surprises for New Owners of California Warehouse
Task: Inspect a distribution warehouse’s sewer system and collect reality capture data of its interior to provide accurate existing conditions documentation for new owners.
Problem
- Client was planning renovations to a recently purchased, 100,000 s.f. warehouse
- No accurate as-builts existed for the facility
- Surprises during renovations could torpedo the project’s budget and schedule
Solution
- GPRS conducted a video pipe inspection to map the facility’s sewer system and document defects
- Sewer inspection revealed debris that appeared to have been intentionally shoved into building’s cleanouts
- The interior of the warehouse was documented with a Matterport Pro 3 scanner
- GPRS’ in-house Mapping & Modeling Team used the Matterport data to create a detailed CAD drawing, 3D model, and virtual tour of the facility
Benefits
- Debris in cleanouts could be addressed before it caused costly damage to the sewer system
- CAD drawings, 3D model, and virtual tour will allow client and their partners to plan renovations and keep accurate records of future O&M throughout building’s life cycle
The Bottom Line: GPRS helped a developer avoid unwanted surprises during renovations to a recently acquired distribution warehouse.
Frequently Asked Questions
What size pipes can GPRS inspect?
Our NASSCO-certified VPI Project Managers can inspect pipes from 2” in diameter and up.
Can you locate pipes in addition to evaluating them for defects?
Yes, our SIM and NASSCO-certified Project Managers use VPI technology equipped with sondes, which are instrument probes that allow them to ascertain the location of underground utilities from an inaccessible location. This allows them to use electromagnetic (EM) locating to map sewer systems at the same time they’re evaluating them for defects.
GPRS Discovers the Location of Two Time Capsules from the 1940s
GPRS utilized ground penetrating radar (GPR) to help locate buried time capsules from the early 1900s before a school’s planned demolition.
GPRS Project Manager Dillon Malang was called out to an elementary school in California to help narrow down the search for these time capsules.
“Our sole task was just to try and find these time capsules that were from, I want to say like the 1930s or 40s,” Malang explained.
The school was set for demolition, and members of the community recalled that time capsules were buried somewhere on the property. However, there was no documentation indicating where these capsules were – or if they truly existed at all.
“So, they pretty much narrowed it down to us for like 250-300 square feet areas just to scan with [ground penetrating] radar,” Malang explained.
When GPRS SIM-certified Project Managers utilize GPR for utility locating or concrete scanning, they rely on the imaging that displays when emitting radio signals into the structure. The radio waves “bounce” off any material it encounters and those bounces are displayed as hyperbolas.
To the untrained eye, it may be unclear what these hyperbolas represent. Our experienced GPRS Project Managers can use this reading to determine the type of material located.
When conducting his investigation, Malang encountered two areas with distinct responses.
“We're able to find two reactions, one in each area, for them to possibly dig up to try and investigate,” Malang explained.
Malang marked the area with spray paint and flags, so the client will be able to investigate whether any of the responses are the missing time capsules without unnecessary, large-scale potholing.
Locating time capsules isn’t an everyday type of job for GPRS’ nationwide team of Project Managers. Whether we’re helping you preserve a community’s history, or assisting with your commercial construction project, our aim is to give you the accurate, actionable data you need to stay on time, on budget, and safe.
Does GPR Have Any Limitations?
Ground and soil conditions, weather, and type of material located are a few of the potential limiting factors.
An experienced GPR technician, like GPRS Project Managers, will be able to assess a site’s condition to determine if GPR is the proper tool for the job. If GPR is limited by the site conditions or other factors, GPRS Project Managers are equipped with complementary utility locating tools to ensure we can still intelligently visualize your built world.
How Can I Determine if GPR is Needed for My Project?
GPR is commonly used to scan and identify subsurface elements. It’s always wise to conduct a GPR scan before beginning any renovation or demolition activities. This typically includes any excavation work deeper than 18”, or any coring, cutting, or drilling of concrete.
The best way to know whether you need GPR is to contact an experienced GPR technician to evaluate your project and its needs. GPRS’ Project Managers not only know how to use GPR properly and efficiently, they also know when it isn’t the best tool for the job and can recommend what works best for the needs of the clients.
With hundreds of GPRS Project Managers stationed all across the United States, you can be sure that there are quality GPR scanning services near you.
What can we help you visualize?
FREQUENTLY ASKED QUESTIONS
What is Subsurface Investigation Methodology?
Subsurface Investigation Methodology (SIM) is a standard operating procedure and set of professional specifications that work as a guide for utility locating experts when scanning for buried utility lines. All GPRS Project Managers are required to achieve SIM 101 certification, which requires 80 hours of hands-on training in a classroom setting and 320 hours of mentorship in the field. For reference, the American Society for Nondestructive Testing’s (ASNT) minimum training recommendation includes eight hours for training and 60 hours practicing GPR to achieve NDT Level 1 certification in ground penetrating radar (GPR) scanning.
SIM requires the use of multiple, complementary technologies, like GPR scanning and electromagnetic (EM) locating, when locating buried utilities or scanning a concrete slab.
What are the Benefits of Underground Utility Mapping?
Having an updated and accurate map of your subsurface infrastructure reduces accidents, budget overruns, change orders, and project downtime caused by dangerous and costly subsurface damage.
Contractors, Unions Provide Feedback on OSHA’s Proposed Heat Rule
Contractors and unions alike have said their piece about a proposed rule aiming to protect workers in the United States from the health risks of extreme heat.
The U.S. Dept. of Labor Occupational Safety and Health Administration (OSHA) held a multiday virtual public hearing earlier this summer as part of the rulemaking process for possible workplace heat injury and illness prevention standards.
Published last summer, the proposed rule would require employers to identify heat-related hazards and implement both engineering controls and safe work practices, using two distinct trigger thresholds. It would also outline procedures for establishing a heat emergency response plan, conducting training for employees and supervisors, and maintaining proper documentation.
The proposed rule applies to a variety of industries, but construction is perhaps the most important due to it being among the leading industries for workplace heat-related illnesses and injuries. According to Bureau of Labor Statistics data, between 2021 and 2022 there were 620 construction workplace injuries that resulted from exposure to environmental heat and required at least one day away from work, and 29 deaths.
OSHA says those numbers are likely lower than the true statistics due to underreporting.

“Heat-related illnesses are significantly underreported for multiple reasons, including a lack of information, communication and fear of retaliation,” Ryan Papariello, safety and health specialist at the Laborers' Health & Safety Fund of North America, told Engineering News-Record. “…We must shift from a reactive to proactive strategy that centers on worker health and safety.”
According to ENR’s reporting, contractor groups have criticized the proposed rule for using what they call “a one-size-fits-all approach” to heat safety. The Associated General Contractors of America and the Associated Builders and Contractors are among the groups calling on OSHA to implement performance-based requirements in the standard, rather than prescriptive measures.
“OSHA should recognize, and I believe has recognized in the past, that the construction industry faces unique challenges compared to those in other industries,” said Kevin Cannon, director of safety and health services at AGC.
Cannon added that construction should be exempt from the temperature record keeping requirements included in the proposed rule.
“Our belief is that this data has limited utility in predicting environmental conditions on future projects and would not necessarily be considered representative sampling or objective data,” he told ENR.
The proposed rule states that employers would need to provide water, a break area and acclimatization for new or returning workers at 80°F. At 90°F, they would also need to provide 15-minute rest breaks every two hours and implement a supervisor or buddy system to observe for heat-related health symptoms.
Joe Xavier, senior director of health and safety at ABC, told ENR that provisions like requiring rest breaks “are impractical and would be exceedingly difficult to manage on construction sites due to time and schedule-based activity interdependencies.” He cited how mandatory breaks for crews placing concrete could cause a strain for contractors managing the timing of trucks, the concrete pour rate and other factors, among other examples of the challenges these types of rules would create.
“ABC recommends that OSHA allows supervisors and employees to work together and coordinate safe approaches for rest breaks focusing on individual employees’ needs, the nature of the work and the specific workplace conditions,” he said.
But Papariello pointed to the seven states that already have some workplace heat standards in place, and the additional ones currently considering them. Like the proposed federal rule, most of the state standards utilize prescriptive approaches to protect workers from extreme heat.
“[They] have shown that feasibility and flexibility are not a barrier,” he said. “In fact, as the more recently developed heat standards illustrate, these can go hand in hand.”
Other states, however, have made moves to reduce the amount of protection they require employers to offer their workers.
And in 2023, Texas legislators passed a bill that, among other effects, eliminated ordinances in Austin and Dallas that established mandatory water breaks for construction workers.
While commenting on OSHA’s proposed rule during a panel in June, Tarn Goelling, international representative at the International Brotherhood of Electrical Workers, shared a story about an electrical worker in Austin, Texas, who returned to his hot jobsite after taking some time off. The worker became pale, confused and dizzy over the course of his workday. He rested in the shade but still felt unwell and left early.
While driving home, the worker passed out and flipped his truck after suffering from heat stroke.
“[The worker was] not properly acclimated to working in extreme heat,” Goelling said at the panel, per ENR’s reporting. “…Many of the injuries and illnesses resulting from exposures to these heat hazards on the job are easily preventable with an appropriate heat illness prevention plan.”
GPRS Is Committed to You & Your Team's Safety
At GPRS, safety is always on our radar.
That’s more than just a catchy tagline; through our sponsorship of safety initiatives such as Concrete Sawing & Drilling Safety Week, Construction Safety Week, and Water & Sewer Damage Awareness Week, we aim to ensure that every employer and employee in the construction industry is equipped with the knowledge and resources they need to stay safe while building for our nation’s future.
Click here to learn more about GPRS’ safety initiatives and partnerships.
FIU Develops Spray-On Concrete System to Revolutionize Bridge Repair
Researchers at Florida International University have developed a spray-on concrete system that they believe could revolutionize how U.S. bridges are repaired.
According to an article in FIU News, engineers at the school have created a system that sprays Ultra-High Performance Concrete (UHPC) onto structures. This type of concrete has the potential to patch walls, fix pipes and restore drainage culverts – and it can make these structures stronger than they were originally.
According to information on the U.S. Department of Transportation website, UHPC is increasingly being used to build and repair America’s transportation infrastructure. Most of the time, these applications of UHPC involve pouring it into place. This UHPC would either be self-consolidating – filling its forms completely under its own weight – or thixotropic – a UHPC that is vibrated and struck off with a vibrating screed under initial placement.
Existing UHPC applications – such as girder end repairs and the restoration or protection of walls and columns – could be enhanced by the ability to spray UHPC directly into place. Emerging or future uses, including bridge deck soffit repairs and culvert rehabilitation or retrofitting, may also benefit from sprayable UHPC.
In these cases, spraying UHPC is often more economical than traditional pouring methods, primarily because it eliminates the need for formwork. Spray application also offers greater flexibility, allowing UHPC to be applied from any angle. This overcomes the limitations of gravity-based pouring, which can be hindered by structural obstructions like bridge decks.
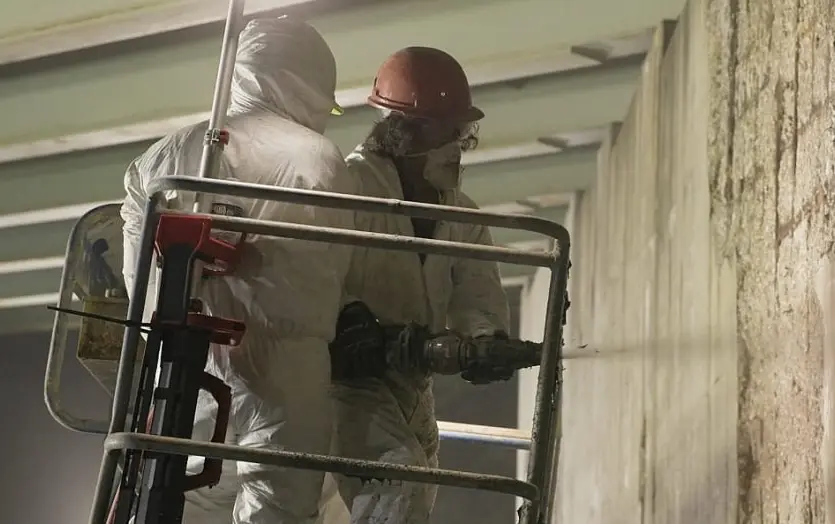
“UHPC has historically been very expensive to use, mainly because most of those available [mixes] on the market have been commercial versions,” said Atorod Azizinamini, a professor of civil engineering and director of a U.S. Department of Transportation-funded research center at FIU. “Even a very thin layer of UHPC can drastically improve the strength of a structure and protect it from water.”
“We have developed an affordable type of UHPC, and a system that can spray it,” Azizinamini continued. “This could become a major tool in repairing or upgrading structurally deficient bridges quickly and efficiently.”
FIU’s UHPC mix comes in at around $500 per cubic yard, which is considerably cheaper than many comparable commercial versions of the product. The school’s application system deposits thin layers of concrete onto surfaces through a nozzle, like how spray paint is applied. These layers can be added, one upon another, in coats. Their light weight doesn’t significantly alter the mass of a structure.
The FIU team used their system and UHPC mix on a bridge in Virginia last year.
“The reason that we invited the FIU team here to Virginia is that we had a bridge abutment wall that had corrosion issues due to the deicing salt that is used here,” said Sam Fallaha, an engineer with the Virginia Department of Transportation. “We liked it because it is easy to apply a thin layer to vertical surface creating a durable solution for problems like these that occur in cold climates.”
The Virginia job was the first-ever application of its kind in the U.S. The Risk and Resilience Tech Hub is investing roughly $1 million into the FIU researchers’ system to commercialize the technology and help the university train more engineers and builders to use it.
"Anyone who has used a glue gun for an arts and crafts project knows how difficult it can be to keep the nozzle from getting clogged,” said Morgan Dickinson, a Ph.D. student in Azizinamini’s lab. “The same goes with our UHPC system. If you don’t know how to clean it, the concrete hardens, and you might have to throw parts away. Fortunately, we are seeing widespread interest in people who want to learn about our system and use it properly.”
Kia Hajifathalian, Vice President and Market General Manager at Baker Construction, told FIU News that he sees the FIU system as a practical way of bringing the benefits of UHPC to more buildings and bridges around the nation.
“This is not just research in a lab that will only have a couple of specific uses,” Hajifathalian said. “I think that FIU has figured out how to utilize UHPC in a way that can be used to repair buildings and bridges at scale.”
"The biggest nightmare of a concrete contractor is pouring concrete, testing it later and finding out that it is not as strong as you thought it would be because something unexpected happened,” he added. “Having that concrete in a pre-bagged system like FIU is doing, where you have quality control, is so important.”
The State of America’s Bridges
There are more than 623,000 bridges across the United States, according to the American Society of Civil Engineers (ASCE) 2025 Report Card for America’s Infrastructure.
The ASCE gave America’s bridges a C in that report card, citing the fact that 49.1% of the country’s bridges are in “fair” condition, 44.1% are in “good” condition, and 6.8% are in “poor” condition.
“Unfortunately, the nation continues to see the number of fair bridges surpassing those in good condition,” the ASCE wrote. “As bridges in fair condition continue to age – presenting the possibility of being further downgraded – they also exemplify an opportunity because they can be preserved at a lower cost than bridges in poor condition.”
Bridges received a significant amount of funding through the Infrastructure Investment and Jobs Act (IIJA), which included $27.5 billion for the Bridge Formula Program and $12.5 billion for the Bridge Investment Program.
“Despite this infusion of federal funding, bridge-related system rehabilitation needs are estimated at $191 billion,” the ASCE wrote. “Therefore, strategic asset management planning and routine maintenance are essential to keeping bridge conditions from further declining and avoiding costly repair or rehabilitation work. While the effects of extreme weather events pose threats to bridges, innovative techniques are improving their security and resilience.”
As we wait to see if innovations like FIU’s spray-on concrete system, or Allium’s stainless-steel-clad rebar truly revolutionize bridge construction and maintenance, it’s important that you know exactly where all reinforcements are within bridge decks and other concrete slabs before you attempt to cut or core that concrete.
Striking rebar, post tension cables or other support systems within concrete can lead to catastrophic structural failure that endangers you and your workers, and anyone else in the vicinity of your job site.
GPRS provides precision concrete scanning and imaging services designed to keep your concrete cutting and coring projects on time, on budget, and safe. Utilizing state-of-the-art ground penetrating radar (GPR) scanners and other, complementary technologies, we visualize where you can and can’t safely penetrate the slab, providing you with accurate, actionable information that helps you plan, build, and manage better.
Our SIM-certified Project Managers have achieved and maintain a 99.8%+ rate of accuracy when scanning concrete slabs for buried rebar, post tension cable, electrical conduit, and any other types of embedded obstructions that could compromise the safety and success of your project. We’re so confident in their abilities that we introduced the Green Box Guarantee, which states that when we place a Green Box within a concrete layout prior to you cutting or coring that slab, we guarantee that the area within will be free of any obstructions.
If we’re wrong, we agree to pay the cost of the damage.
From bridges to skyscrapers, GPRS Intelligently Visualizes The Built World® to keep your projects on time, on budget, and safe.
What can we help you visualize?
Frequently Asked Questions
How is GPR used to identify tendons vs. rebar in a post-tensioned slab?
In post-tensioned structures, we typically find one mat of support rebar near the base of the slab. This mat is generally consistently spaced and remains at a constant elevation.
Post-tension cables are generally found above this support mat and “draped” throughout the rest of the structure. The elevation of the cable is usually high near the beams and column lines and drapes lower through the span between beams and column lines. Knowledge of these structural differences allows us to accurately differentiate between components. Our Project Managers will leave you feeling confident in our findings and in your ability to drill or cut without issue.
What types of concrete scanning does GPRS provide?
GPRS provides two specific but different scanning services: elevated concrete slab scanning and concrete slab-on-grade locating. Elevated concrete slab scanning involves detecting embedded electrical conduits, rebar, post-tension cables, and more before core drilling a hole through the slab. Performing a concrete slab-on-grade locating service typically involves scanning a trench line for conduits before conducting saw cutting and trenching to install a sanitary pipe, water line, or something similar.
TI to Invest Over $60B in U.S. Semiconductor Fabs
Texas Instruments (TI) is investing more than $60 billion across seven U.S. semiconductor fabs, marking the largest investment in foundational semiconductor manufacturing in U.S. history.
In a press release on the company’s website, TI said it is expanding its U.S. manufacturing capacity to supply the growing need for semiconductors that will advance critical innovations from vehicles to smartphones to data centers.
As part of this investment, TI is building and ramping seven, large-scale, connected fabs – specialized factories for producing semiconductors – across three manufacturing mega-sites in Texas and Utah. The sites are expected to support more than 60,000 jobs and produce hundreds of millions of chips daily.
“TI is building dependable, low-cost 300mm capacity at scale to deliver the analog and embedded processing chips that are vital for nearly every type of electronic system,” said Haviv Ilan, president and CEO of Texas Instruments. “Leading U.S. companies such as Apple, Ford, Medtronic, NVIDIA and SpaceX rely on TI’s world-class technology and manufacturing expertise, and we are honored to work alongside them and the U.S. government to unleash what’s next in American innovation.”
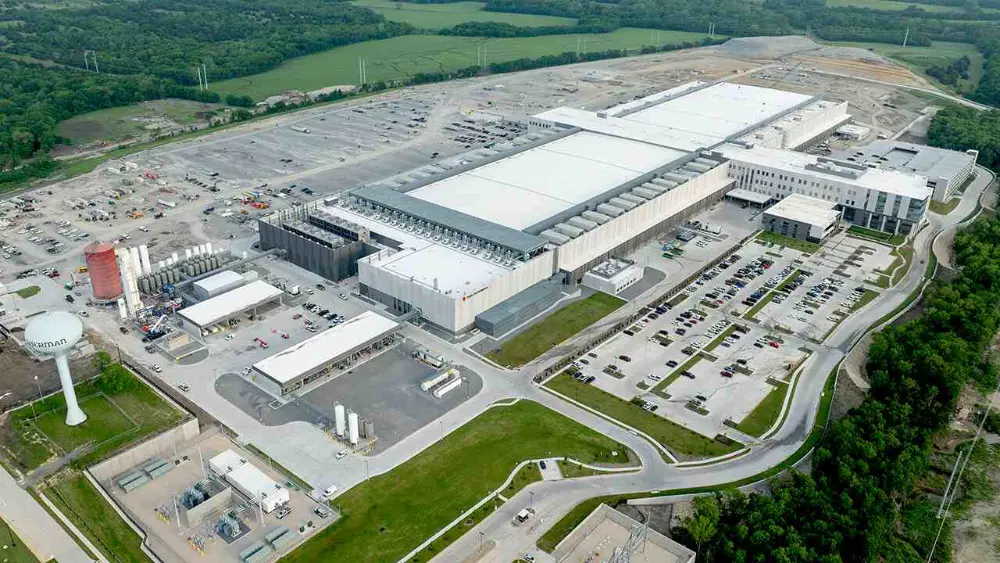
TI’s first new fab in Sherman, Texas will begin initial production this year, just three years after breaking ground. Construction on the exterior shell of a second new fab in Sherman is also complete, with two more fabs currently in the planning phase.
TI’s second fab in Richardson, Texas continues to ramp up to full production alongside the world’s first 300mm analog fab, which opened in 2011.
In Lehi, Utah, TI is currently ramping its first 300mm wafer fab with construction on a connecting fab well underway.
“For nearly a century, Texas Instruments has been a bedrock American company driving innovation in technology and manufacturing,” said U.S. Secretary of Commerce, Howard Lutnick. “…Our partnership with TI will support U.S. chip manufacturing for decades to come.”
TI is the largest foundational semiconductor manufacturer in the U.S., producing analog and embedded processing chips for everything for nearly every electronic device in use today. The company said that it is expanding its U.S. manufacturing presence to meet the steadily growing demand for these chips and help its customers pioneer the next wave of technological breakthroughs.
“Texas Instruments' American-made chips help bring Apple products to life, and together, we’ll continue to create opportunity, drive innovation, and invest in the future of advanced manufacturing across the U.S.,” said Apple’s CEO Tim Cook.
Besides Apple, TI provides semiconductors to major companies such as Ford Motor Company, Medtronic, and NVIDIA.
“At Medtronic, our life-saving medical technologies rely on semiconductors to deliver precision, performance, and innovation at scale,” said Geoff Martha, Medtronic chairman and CEO. “Texas Instruments has been a vital partner – especially during the global chip shortages – helping us maintain supply continuity and accelerate the development of breakthrough therapies. We’re proud to leverage TI’s U.S.-manufactured semiconductors as we work to transform healthcare and improve outcomes for patients around the world.”
“NVIDIA and TI share the goal to revitalize U.S. manufacturing by building more of the infrastructure for AI factories here in the U.S.,” added Jensen Huang, founder and CEO of NVIDIA. “We look forward to continuing our collaboration with TI by developing products for advanced AI infrastructure.”
Whether you’re building a semiconductor fab or a skyscraper, ensuring the success of a construction project always starts with ensuring you have accurate data of what’s already on your site.
GPRS provides a comprehensive suite of subsurface damage prevention, existing conditions documentation, and construction and facilities project management solutions to keep your projects on time, on budget, and safe. We’re with you every step of the way, from initial design to O&M, Intelligently Visualizing The Built World® to ensure you can plan, build, and manage better.
What can we help you visualize?
Frequently Asked Questions
What do I get when I hire GPRS to conduct a utility locate?
Our Project Managers flag and paint our findings directly on the surface. This method of communication is the most accurate form of marking when excavation is expected to commence within a few days of service.
GPRS also uses a global positioning system (GPS) to collect data points of findings. We use this data to generate a plan, KMZ file, satellite overlay, or CAD file to permanently preserve results for future use.
GPRS does not provide land surveying services. If you need land surveying services, please contact a professional land surveyor.
Please contact us to discuss the pricing and marking options your project may require.
Can GPRS locate PVC piping and other non-conductive utilities?
GPR scanning is exceptionally effective at locating all types of subsurface materials. There are times when PVC pipes do not provide an adequate signal to ground penetrating radar equipment and can’t be properly located by traditional methods. However, GPRS Project Managers are expertly trained at multiple methods of utility locating.
GPRS Clears Up Confusion With Accurate Concrete Scans at DFW High-Rise
A general contractor in the Dallas-Fort Worth area wasted $30,000 on two sub-par concrete scanning and imaging investigations of what they were told were post-tensioned concrete slabs inside a high-rise office building.
The building engineer on the renovation project initially required the slabs be inspected with concrete X-ray to clear safe coring locations. The X-ray company told the GC and their concrete corer that the slabs were post-tensioned – but they did not trust that information, or the data they received indicating where they could and could not safely drill into the slabs.
While concrete X-ray can be a reliable way to obtain information about infrastructure embedded within concrete slabs, GPR has proven to be the superior technology for these types of investigations.
GPR scanning is safer, faster, and cheaper than X-ray. Unlike X-ray, GPR scanners emit no harmful radiation and can visualize the infrastructure inside a slab without needing access to both sides. And GPR scanners are less bulky than X-ray and require little set-up time, meaning an investigation into your project’s slabs will not cause delays to your schedule.
But even the right technology for the job isn’t going to give you accurate results if the operator isn’t properly trained.
After the X-ray scan failed to provide accurate results, a GPR investigation of the high-rise’s slabs by a local company yielded a similar result: neither the contractor, nor the subcontractor, felt confident in coring based on the data they received.
“Between the other GPR and the X-ray company, the coring company and GC were still not confident in their markings and information provided,” said GPRS Area Manager Zack Walter.
GPRS stepped in to solve the problem, providing precision concrete scanning services that put the project back on track.
Project Manager Reynaldo Rodriguez demonstrated the accuracy of GPRS’ concrete scanning – utilizing GPR in conjunction with electromagnetic (EM) locating – to the building engineer, general contractor and subcontractor, and eventually re-scanned all the areas that the other two companies had previously investigated.
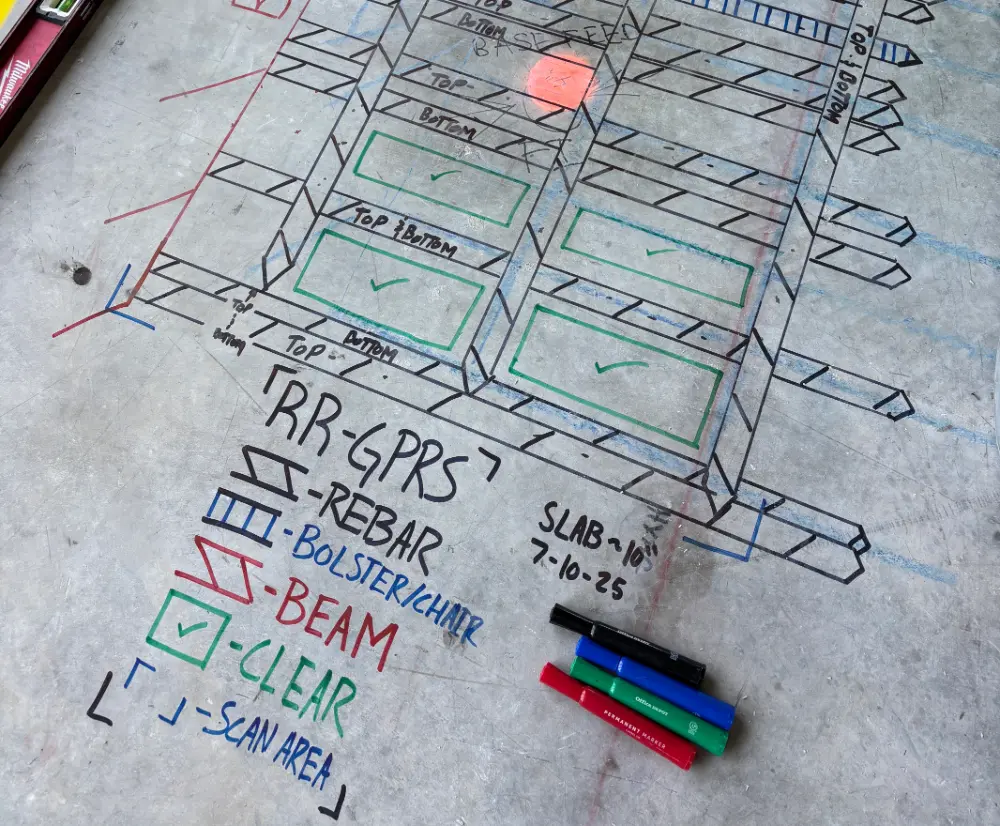
How GPRS Provides Industry-Leading Concrete Scanning
Using complementary technologies during our subsurface investigations is just one of the ways GPRS’ SIM-certified Project Managers have achieved and maintain a 99.8%+ rate of accuracy when scanning concrete slabs and locating underground utilities.
GPR scanners emit radio waves into a surface such as concrete or into the ground, then detect the interactions between those waves and anything below the surface. These interactions are displayed on a readout as a series of hyperbolas that vary in size and color depending on what type of material was detected. GPRS Project Managers are specially trained to interpret this data to indicate the location and approximate depth of these buried items and help you avoid the costly – and potentially dangerous – consequences of damaging them while breaking ground.
EM locators are a perfect complementary technology to GPR scanners because they detect the electromagnetic signals radiating from metallic pipes and cables, rather than the utilities themselves.
These signals can be created by the locator’s transmitter applying current to the pipe, or from current flow in a live electrical cable. They can also result from a conductive pipe acting as an antenna and re-radiating signals from stray electrical fields (detected by the EM locator functioning in Power Mode) and communications transmissions (Radio Mode).
Signals are created by the current flowing from the transmitter which travels along the conductor (line/cable/pipe) and back to the transmitter. The current typically uses a ground to complete the current. A ground stake is used to complete the circuit through the ground.
Using complementary technologies such as GPR and EM locating allows GPRS to create a redundant confirmation, ensuring the repeatability of our process and the accuracy of our findings.
When scanning concrete, our Project Managers will mark safe places to cut or core with green boxes. The GPRS Green Box Guarantee is a proprietary program stating that, if you cut or core within one of these green boxes and damage an embedded item, GPRS will pay the cost of any damage that occurs.
What We Found
Not only did Rodriguez discover major discrepancies between what he found embedded in the slabs and what the previous companies said was there – he also confirmed that the slabs were not post-tensioned after all.
Rodriguez walked the general contractor and concrete coring company through his findings, ensuring they understood the data and knew how to proceed safely with their work.
From skyscrapers to sewer lines, GPRS Intelligently Visualizes The Built World® to keep your projects on time, on budget, and safe.
What can we help you visualize?
Frequently Asked Questions
What types of concrete scanning are there?
GPRS provides two specific but different scanning services: elevated concrete slab scanning and concrete slab-on-grade locating. Elevated concrete slab scanning involves detecting embedded electrical conduits, rebar, post-tension cables, and more before core drilling a hole through the slab. Performing a concrete slab-on-grade locating service typically involves scanning a trench line for conduits before conducting saw cutting and trenching to install a sanitary pipe, water line, or something similar.
How is GPR used to identify tendons vs. rebar in a post-tensioned slab?
In post-tensioned structures, we typically find one mat of support rebar near the base of the slab. This mat is generally consistently spaced and remains at a constant elevation. Post-tension cables are generally found above this support mat and “draped” throughout the rest of the structure. The elevation of the cable is usually high near the beams and column lines and drapes lower through the span between beams and column lines. Knowledge of these structural differences allows us to accurately differentiate between components. Our Project Managers will leave you feeling confident in our findings and in your ability to drill or cut without issue.
How Reality Capture Powers Mobile Wayfinding Apps and Software
Many people rely on their smartphones to find directions, whether they're driving, walking, or exploring a new city. Most smartphones today come with GPS apps that show where you are on the map and provide turn by turn directions. This dynamic, personalized navigation has become second nature to most users.
To advance digital navigation, wayfinding software companies are leveraging reality capture technology to deliver real-time navigation through complex buildings and campuses, helping users orient themselves and move efficiently.
Reality capture provides accurate data for wayfinding, capturing accurate details of complex indoor and outdoor environments. It delivers digital representations of real-world spaces that can be used by software companies to develop intuitive and efficient navigation systems.
According to Conquest Creatives, “Good wayfinding systems significantly enhance the user experience by reducing stress, saving time, and ensuring safety. In complex environments like hospitals, airports, and campuses, effective wayfinding can be critical to the smooth operation of these spaces. It supports accessibility, ensuring that everyone, including those with disabilities, can navigate easily.”
What Is Wayfinding?
Wayfinding is the process of navigating a physical site and finding an optimal route to reach a destination, whether it be a specific room or building. Wayfinding technology provides real-time navigation through unfamiliar or intricate layouts across both indoor and outdoor environments.
Many companies are developing wayfinding platforms to help users reach their destination in complex spaces, such as hospitals, airports, shopping centers, and corporate campuses. Customized software and apps can be installed on a user’s smartphone and interactive kiosks on site.
These applications calculate routes between specific points or areas of interest and display them on interactive maps. When integrated with indoor positioning systems, they replicate the “blue dot” experience familiar from outdoor navigation tools like Google Maps. This allows users to locate themselves and navigate accurately without relying on GPS.
Vince Palko, GPRS Marketing Director, has spent many years in the digital geolocation realm, and has seen this evolution firsthand, “As digital interaction becomes more embedded in daily life, wayfinding apps have emerged as an innovative tool to help people navigate complex environments.”

Who Benefits from Wayfinding?
According to WaveTech, the key features of interactive wayfinding systems are designed to make navigating complex facilities more straightforward and efficient.
Wayfinding technology supports a wide range of users.
- Visitors who are unfamiliar with a location gain confidence and clarity in finding their way.
- Individuals with visual or hearing impairments can navigate more independently.
- Users speaking different languages can receive instructions in their preferred language to help navigate spaces.
- Emergency services can be assisted by providing real-time navigation and location tracking, enabling faster and more coordinated response efforts.
- In disaster planning, these tools help map evacuation routes, identify critical infrastructure, and visualize risk zones to enhance preparedness.
- By alerting users to hazards and guiding safe movement, wayfinding technology plays a key role in risk mitigation, including managing crowd flow to reduce congestion and panic.
Even those familiar with a location benefit from real-time information that improves efficiency and engagement, particularly in healthcare settings where it can strengthen patient loyalty and satisfaction.
According to UC Santa Cruz professor of Computer Science and Engineering Roberto Manduchi, "apps will enable blind people to navigate indoor buildings with spoken directions from a smartphone app, providing a safe method of wayfinding where GPS doesn’t work.”
Data Types Needed for Wayfinding Apps
Wayfinding apps provide precise step-by-step navigation using detailed 3D maps. They offer a complete navigation experience that begins at home, continues through parking, and ends at the destination. Routes can be tailored to meet individual needs, including accessibility requirements. Real-time updates and location-aware guidance reduce frustration and help prevent missed appointments by adjusting routes dynamically based on current conditions.
Wayfinding apps rely on a variety of data types to function effectively. Here's a breakdown of the key data types they typically need:
Spatial Data
- Floor plans and site maps to show accurate layouts of buildings and campuses
- 3D models using reality capture technology such as LiDAR and photogrammetry to create digital twins
- Geospatial coordinates to define locations and routes
Positioning Data
- GPS data to support outdoor navigation
- Indoor positioning systems to locate users with Bluetooth beacons, Wi-Fi signals, inertial measurement units, or magnetic field mapping
- Real-time location tracking to update user position dynamically
Routing & Navigation Data
- Pathways and connections to provide information on walkways, corridors, elevators, stairs, and ramps, etc.
- Accessibility features to support users with mobility challenges
- Points of interest to locate restrooms, guest services, entrances, and exits
Environmental & Operational Data
- Live updates on construction zones, temporary closures, and detours
- Traffic flow in busy environments like airports and hospitals
Visual & AR Data
- Augmented reality guidance onto real-world views
- Preview routes through 3D walkthroughs and visual simulations
How Reality Capture Technology Supports Wayfinding
Reality capture technologies such as 3D laser scanning and photogrammetry equipment captures detailed spatial data of a site, including the building’s exterior and interior floorplans, sidewalks, parking lots and garages, entrances and exits, accessibility features, stairways, and more. In addition to capturing this spatial data, the scanner captures positioning data, routing and navigation data, environmental and operational data, and visual and AR data.
Comprehensive site data is used to create a 3D BIM model and a unified site map, which can be integrated into mobile wayfinding apps to help users navigate the site easily.
These BIM models serve as digital twins, forming the foundation for precise navigation and route planning. In complex indoor settings like hospitals and airports, reality capture ensures that floor plans and spatial data reflect the actual layout.
This technology enables wayfinding apps to map both indoor and outdoor environments with precision, identifying features such as ramps, elevators, stairs, and obstacles. Augmented reality can be layered onto real-world imagery, guiding users visually and intuitively. Users can preview their routes in immersive 3D before beginning navigation, and the app remains reliable even in areas where GPS signals are unavailable.
GPRS Reality Capture Services for Wayfinding Companies
GPRS Reality Capture Services delivers the precise spatial data needed to power wayfinding apps and enable real-time AR navigation to help users confidently navigate complex indoor and outdoor environments.
We have Project Managers in every major U.S. market ready to quickly document accurate site data. Our Project Managers undergo an extensive SIM certification training program to ensure their competence in laser scanning equipment, field knowledge, and providing accurate data for every project.
Our Project Managers use state-of-the-art equipment to document existing site conditions. With Leica 3D laser scanners, we deliver data efficiently and with an accuracy of 2-4 mm and with the Matterport Pro3, updated with LiDAR-based scanning, we can deliver 20mm accuracy.
Scans are taken in multiple positions around a site from varying viewpoints. Millions of data points are captured and processed into a point cloud, creating an accurate 3D as-built data set of the site. This all happens very quickly, with some scanners, like our Leica RTC360, capturing and calculating 2 million points per second with 2-4 mm accuracy.
Reality capture data can be collected as environments change, helping to maintain the accuracy of wayfinding apps. Frequent scans detect layout modifications, construction zones, and temporary barriers, ensuring that navigation data will remain current. This information supports augmented reality solutions that overlay digital directions onto the user’s view of the physical space.
By integrating LiDAR data with GPS, inertial measurement units, and Bluetooth beacons, wayfinding apps achieve greater precision. GPS supports outdoor navigation, while IMUs and beacons provide reliable indoor positioning where GPS signals are weak or absent. These combined technologies allow for accurate turn-by-turn directions and identification of relevant points of interest.
Reality capture provides the essential data needed to build wayfinding apps that are accurate, dependable, and user-friendly across a variety of environments.
Case Study: Reality Capture of Six Hospital Parking Garages for Wayfinding
GPRS captured precise digital representations of six uniquely structured parking garages at a healthcare campus in Atlanta, enabling a software company to build a wayfinding app that improved navigation for patients and visitors. Read the full case study.

Problem:
- The hospital campus featured multiple parking structures with inconsistent layouts, some aboveground, some underground, and some interconnected across levels.
- Patients and visitors frequently experienced difficulty navigating from their vehicles to their medical offices, resulting in frustration, delays, and operational strain on staff.
- The total space reality captured was 1,681,500 SF and included the following parking garages within the scope of work:
- Green Parking Garage - 6 Levels - 510,000 SF
- Blue Parking Garage - 2 Levels - 160,500 SF
- Purple Parking Garage - 5 Levels - 222,500 SF
- Gold Parking Garage - 3 Levels - 271,000 SF
- North Employee Garage - 6 Levels - 285,000 SF
- South Employee Garage - 5 levels - 232,500 SF
Solution:
- Before reality capture began, the team conducted walkthroughs of each parking deck with the client to confirm the scope and develop scanning strategies tailored to the vast and complex layouts, ensuring no disruption to hospital operations.
- Over the course of just one week, a three-person GPRS team used the Matterport Pro 3 and Leica RTC360 laser scanners to capture every parking level, space, stairway, and hospital access point.
- Accurate reality capture data was used to create individual 3D BIM models for each parking garage and a unified campus model, which served as the foundation for generating 2D plans and immersive virtual tours.
- Deliverables were integrated by the software company into a mobile wayfinding app featuring AR capabilities and indoor positioning to guide users through the hospital campus with ease.
Benefits:
- Reality capture provided the spatial accuracy needed to power the app’s real-time AR navigation and location-saving features.
- The 3D BIM model formed the foundation for accurate routing, orientation, and destination mapping.
- Reality capture supported augmented reality (AR) overlays by aligning digital cues, like directional arrows or points of interest, with physical features in real-world spaces.
- Accurate wayfinding reduced staff reliance for wayfinding assistance and improved operational efficiency across the campus.
- Additionally, the CAD and BIM files can be used to support future upgrades and ongoing maintenance.
What Can GPRS Help You Visualize?
By delivering precise, real-time spatial data, reality capture empowers wayfinding software developers to build highly accurate navigation tools for complex indoor and outdoor environments. From hospitals and airports to campuses and commercial centers, these innovations enhance user experience, improve operational efficiency, and support inclusivity for all users.
GPRS Reality Capture Services provide the high-resolution 3D data that forms the foundation of these advanced wayfinding systems. In environments where accuracy is critical, GPRS helps ensure your navigation tools are dependable and up to date. Whether you're developing a mobile app or an interactive kiosk, our regularly updated scans and 3D BIM models make it easy to deliver seamless, user-friendly navigation experiences.
With GPRS, you gain a trusted partner in creating intelligently navigable spaces, powered by data you can rely on.
Contact GPRS today for more information on reality capture services for wayfinding companies, software, and apps.
Frequently Asked Questions
What is reality capture?
Reality capture is the process of digitally documenting physical environments using technologies like 3D laser scanning and photogrammetry. It produces accurate spatial data that can be used to create models, maps, and visualizations for design, construction, and asset management.
Why is reality capture better than traditional mapping methods for wayfinding?
Traditional mapping often lacks the spatial detail and real-time adaptability needed for indoor or multi-level navigation. Reality capture provides centimeter-level accuracy and enables features like AR navigation, indoor positioning, and dynamic route updates. This leads to smoother user experiences, reduced confusion, and better operational efficiency in places like hospitals or event venues.
Comparing Construction Manager at Risk and Design-Build
Construction Manager at Risk (CMAR) and Design-Build (DB) are two of the most used construction delivery methods today.
Which method is right for you? The answer could be either – or neither, depending on a variety of factors.
Understanding the subtle differences between CMAR and DB is your first step toward deciding which is right for your project – or if you need to explore another option.
Defining the Models
CMAR is a delivery method where the owner hires a construction manager (CM) during the design phase.
The CM provides input on constructability – the degree to which a building’s design facilitates efficient and effective construction – cost estimating and scheduling. They then assume the role of general contractor during construction.
The CM guarantees the project’s cost through a Guaranteed Maximum Price (GMP), assuming financial risk if costs exceed that threshold.
DB consolidates design and construction responsibilities under a single entity – the design-builder. Communication and accountability are streamlined, because the owner contracts with one party overseeing both design and project execution.
Contractual Relationships and Communication Flow
A major difference between CMAR and DB lies in how their contracts are structured.
CMAR involves three primary entities: the owner, the designer (typically an architect or engineer), and the construction manager. The owner holds separate contracts with the designer and the CM, fostering a collaborative but segmented relationship. This separation allows the designer to act as the owner’s advocate, maintaining design integrity and oversight throughout the construction process.
DB merges design and construction into a single contract between the owner and the design-builder.
This unified structure can reduce adversarial relationships and streamline decision-making. However, it also means the designer is no longer an independent advocate for the owner. This can raise concerns about checks and balances, especially in complex or highly regulated projects.
Risk Allocation and Cost Control
Risk management is a defining feature of both models, but in different ways.
In CMAR, the construction manager assumes risk for cost overruns beyond the GMP. This incentivizes accurate cost estimation and efficient construction practices. The owner benefits from early cost visibility and can make informed decisions during the design phase.
DB shifts more risk to the design-builder, who must deliver the project on time and on budget. There are fewer surprises, but more pressure is on the design-builder to effectively manage both design and construction risks.
Owners must be diligent in defining project requirements upfront, as changes later in the process can be harder to implement.
Schedule and Delivery Speed
CMAR and DB both offer scheduling advantages over traditional Design-Bid-Build.
With CMAR, the CM is involved early. This enables phased construction and the ability to overlap design and build activities, which can speed up project delivery.
DB is typically faster than CMAR, because the integrated team can begin construction before the design is complete. Streamlined coordination and no bidding contribute to significant time savings. This makes DB a good choice for projects with tight deadlines.

Collaboration and Innovation
With CMAR, the owner, designer, and CM work together during preconstruction. This model encourages transparency and shared decision-making, which benefits projects requiring high levels of customization or technical complexity.
DB can drive innovation through close coordination between design and construction teams. Fewer contractual barriers allow for more creativity and quicker problem solving.
The owner's influence over design decisions may be more limited. This puts more pressure on the design-builder’s ability to balance aesthetics, functionality, and cost.
Quality and Accountability
Quality assurance is another area where CMAR and DB differ.
In CMAR, the designer remains independent and can monitor construction quality on behalf of the owner. This oversight helps ensure that the project adheres to design intent and regulatory standards.
In DB, the design-builder handles both design and construction quality. While this can lead to efficiencies and fewer disputes, it also means the owner must rely on the design-builder’s internal quality controls. Choosing a reputable and experienced design-builder becomes critical to ensuring quality.
Suitability and Project Types
Choosing between CMAR and DB often depends on project characteristics and owner priorities.
CMAR is well-suited for complex projects where the owner desires a high degree of control over design and values the independent oversight of a separate designer. It is commonly used in public sector projects, healthcare facilities, and higher education buildings.
DB excels in projects where speed, cost certainty, and streamlined communication are paramount. It is frequently employed in infrastructure, industrial, and commercial developments, especially when the scope is well-defined and the owner is comfortable delegating design responsibility.
Let GPRS Keep You In Control of Your Projects
Both Construction Manager at Risk and Design-Build offer advantages over traditional delivery methods. But they cater to different project needs and organizational preferences.
Successful project delivery ultimately hinges not just on the delivery method you choose, but on the quality of the team, the clarity of the project vision, and the strength of communication throughout the process.
The best way to ensure strong, clear lines of communication throughout your project’s lifecycle is by ensuring that the data you’re planning, designing, and building off is accurate and actionable.
GPRS provides you with 99.8%+ accurate utility locates and concrete imaging, pinpoint-accurate leak detection, NASSCO-certified video pipe inspections, and construction-grade reality capture services that help you plan, manage, and build better.
All this accurate, actionable data is always at your fingertips thanks to SiteMap® (patent pending), our infrastructure mapping, and construction and facilities project management software application that provides you with 24/7, secure access to the information you and your team needs to stay on time, on budget, and safe.
What can we help you visualize?
Can Stainless-Clad Rebar Extend the Lifespan of U.S. Bridges?
A Massachusetts startup claims its stainless-steel-bonded rebar can extend bridge deck service life to 100 years or more – and the reinforcements are already being used in California.
Allium Engineering, founded by MIT alumni Steven Jepeal and Sam McAlpine, developed the stainless-steel-clad rebar to be resilient to corrosion.
Rusty rebar can crack the concrete around it, making bridges more susceptible to collapsing. Eliminating the possibility of corrosion means reducing the number of repairs and extending the life of critical infrastructure such as bridges.
“Across the U.S., the typical bridge deck lasts about 30 years on average — we’re enabling 100-year lifetimes,” Jepeal told MIT News. “There’s a huge backlog of infrastructure that needs to be replaced, and that has frankly aged faster than it was expected to, largely because the materials we were using at the time weren’t cut out for the job. We’re trying to ride the momentum of rebuilding America’s infrastructure, but rebuild in a way that makes it last.”
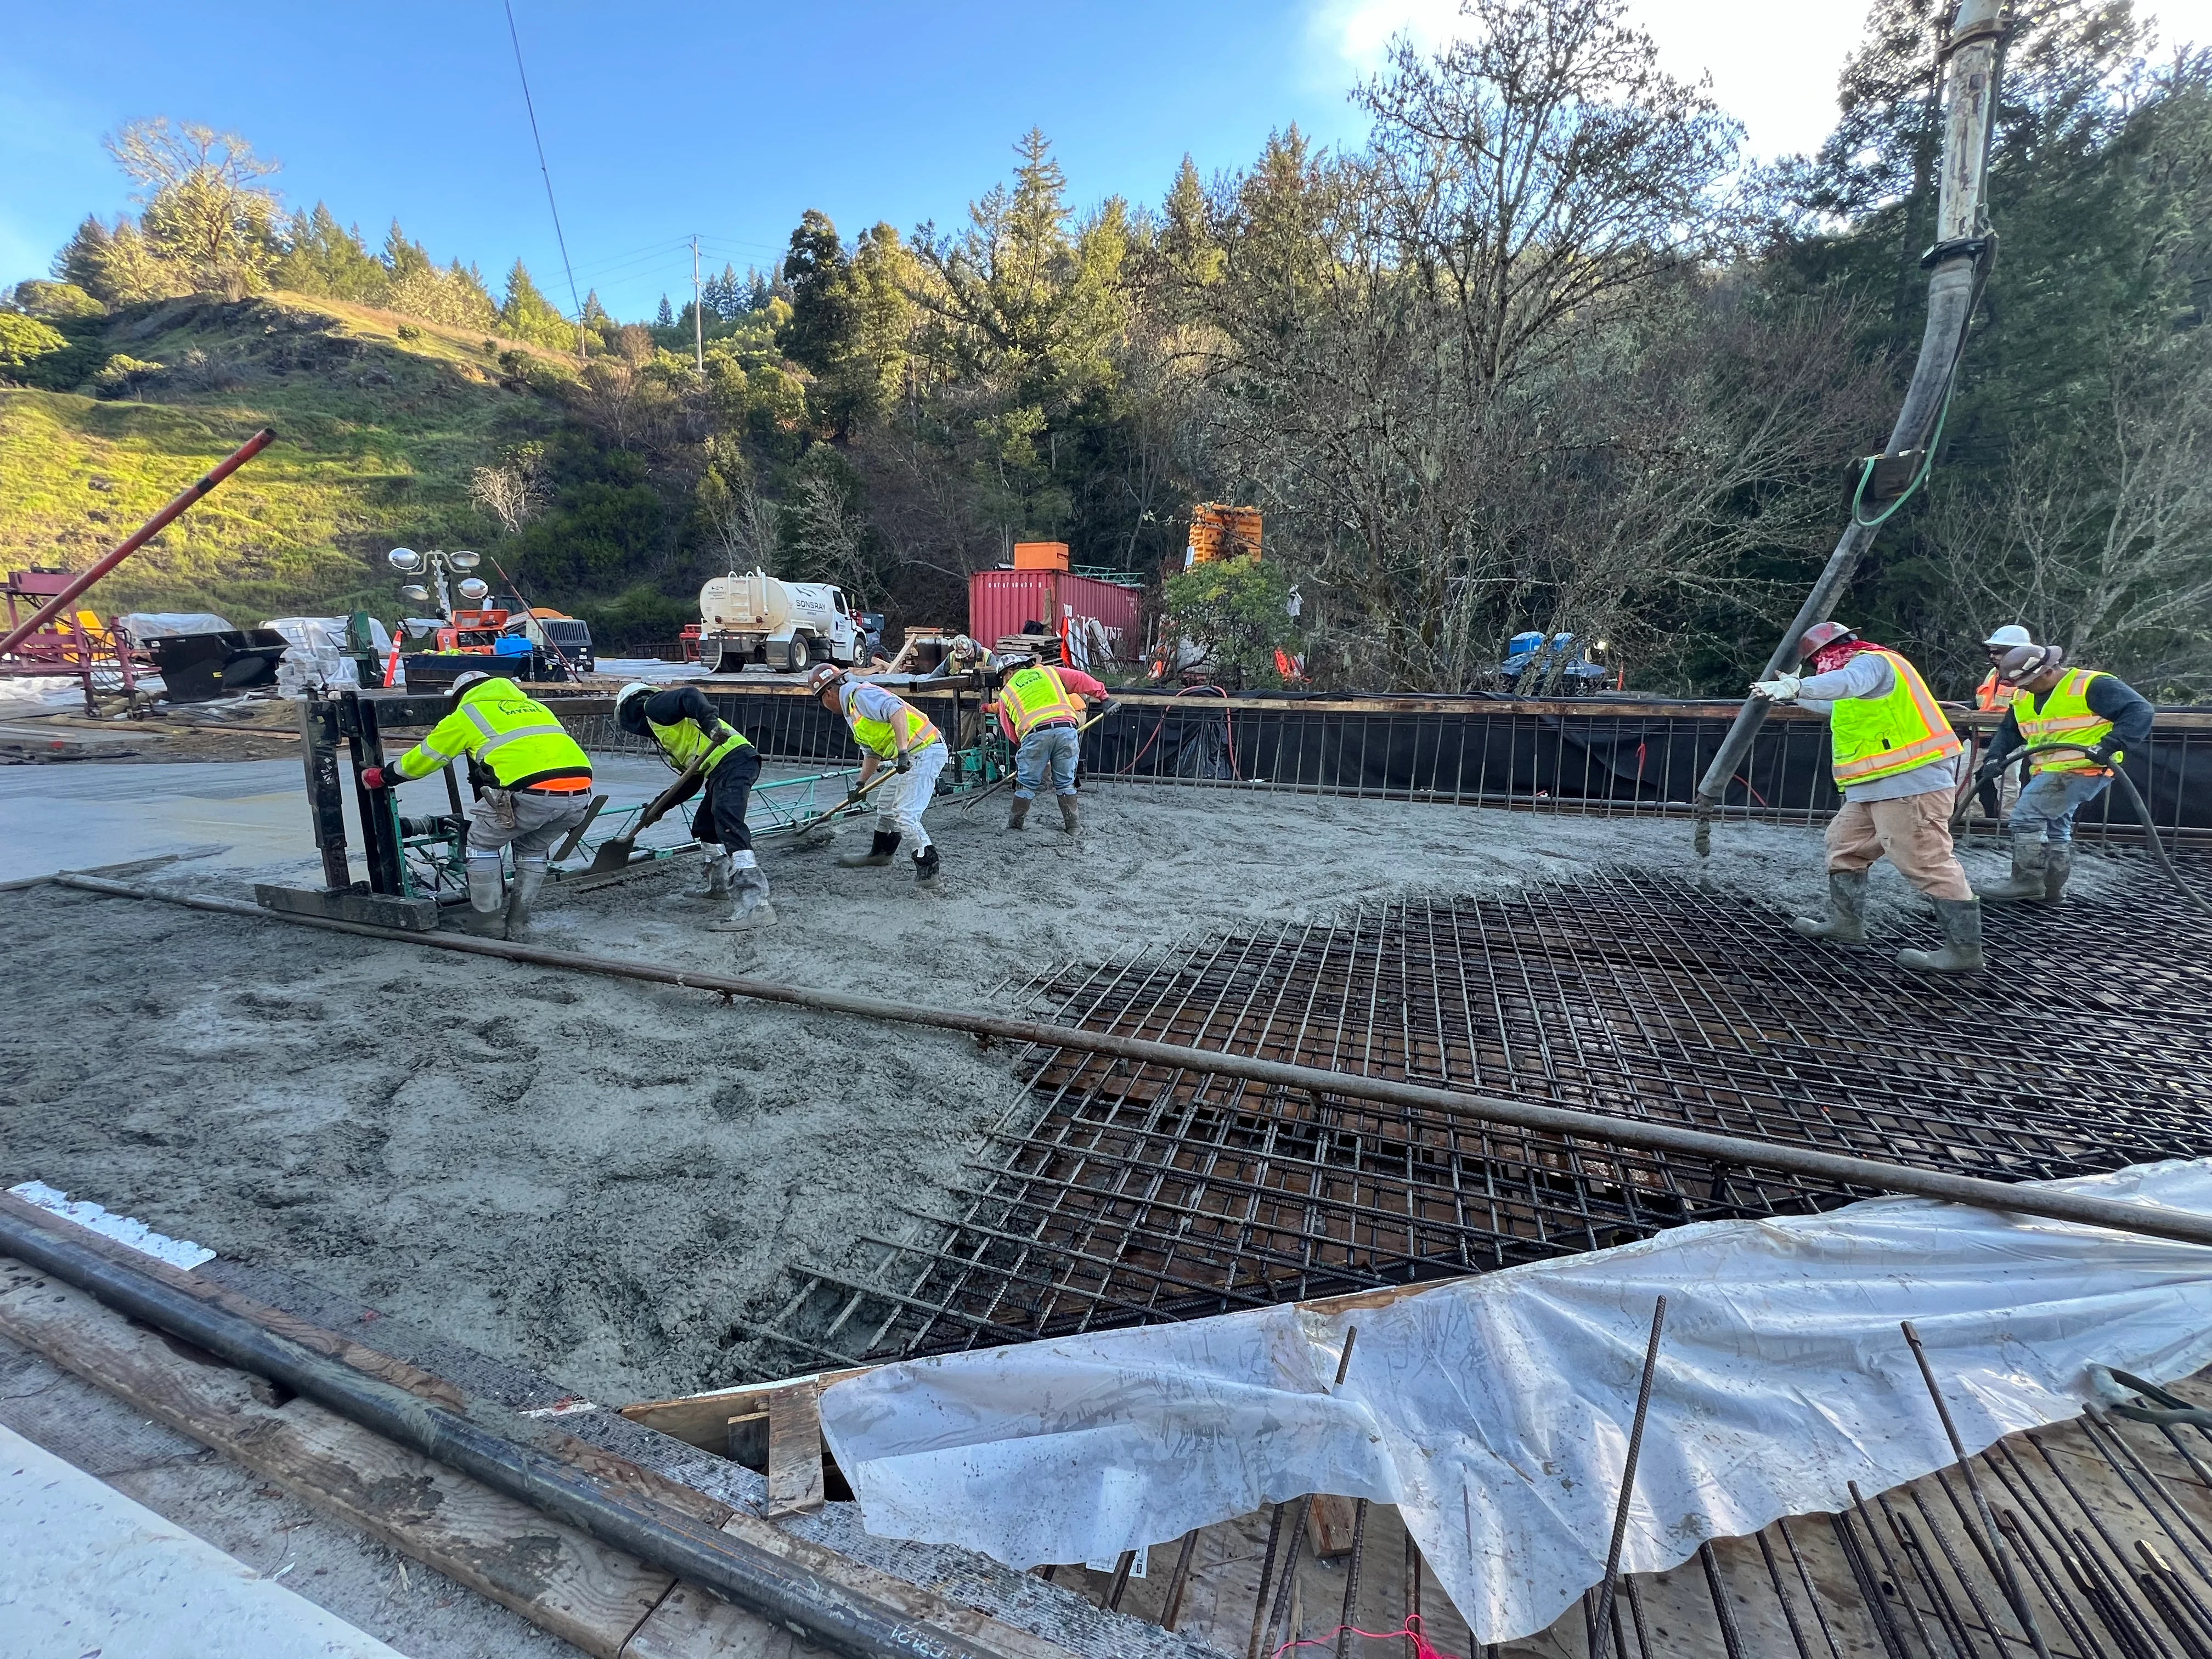
Allium’s process involves adding a thin, protective layer (less than 1-mm-thick) of Type 316 stainless steel on top of traditional ASTM A615/A706 carbon-steel rebar to make it more resistant to corrosion. The resulting mix has no gaps, breaks, or hard barriers between the two materials.
The innovation has already seen significant use, with roughly 100,000 lbs. of the rebar installed as part of construction projects around the U.S.
“We integrate our system into mills so they don’t have to do anything differently,” Jepeal explained. “We add everything we need to make a normal product into a stainless-clad product so that any mill out there can make a material that won’t corrode. That’s what needs to happen for all of the world’s infrastructure to be longer lasting.”
According to a recent Engineering News-Record article, Caltrans installed about 70,000 lbs. of the reinforced rebar on the Long Valley Creek Bridge deck along U.S. 101 in Mendocino County in the spring of 2025. The project – which marked the first use of stainless-bonded rebar on a California bridge – wrapped in April, and the California Department of Transportation continues to evaluate the rebar as it does with all new materials.
“Allium exceeded expectations,” said Gregg Granillo, vice president of fabricator ALTA Rebar, who provided a testimonial about using the product. “…our ironworkers found it familiar and easy to use.”
Allium shared a lifecycle analysis for the Caltrans deck with ENR, which is based on publicly available data from Caltrans and the Federal Highway Administration. The analysis stated a projected 87% reduction in deck ownership cost over 75 years due to savings such as less maintenance cost to replace deck rebar that’s worn down by traffic.
Caltrans has yet to release its project evaluation data, and Allium’s numbers have not undergone independent review.
“We designed it to behave exactly like conventional rebar in the field – same bends, same specs – so engineers aren’t relearning the basics,” McAlpine told ENR. “They’re just gaining corrosion resistance.”
The State of America’s Bridges
There are more than 623,000 bridges across the United States, according to the American Society of Civil Engineers (ASCE) 2025 Report Card for America’s Infrastructure.
The ASCE gave America’s bridges a C in that report card, citing the fact that 49.1% of the country’s bridges are in “fair” condition, 44.1% are in “good” condition, and 6.8% are in “poor” condition.
“Unfortunately, the nation continues to see the number of fair bridges surpassing those in good condition,” the ASCE wrote. “As bridges in fair condition continue to age – presenting the possibility of being further downgraded – they also exemplify an opportunity because they can be preserved at a lower cost than bridges in poor condition.”
Bridges received a significant amount of funding through the Infrastructure Investment and Jobs Act (IIJA), which included $27.5 billion for the Bridge Formula Program and $12.5 billion for the Bridge Investment Program.
“Despite this infusion of federal funding, bridge-related system rehabilitation needs are estimated at $191 billion,” the ASCE wrote. “Therefore, strategic asset management planning and routine maintenance are essential to keeping bridge conditions from further declining and avoiding costly repair or rehabilitation work. While the effects of extreme weather events pose threats to bridges, innovative techniques are improving their security and resilience.”
Whether or not innovations like Allium’s stainless steel-clad rebar truly revolutionize bridge construction and maintenance, it’s important that you know exactly where all reinforcements are within bridge decks and other concrete slabs before you attempt to cut or core that concrete.
Striking rebar, post tension cables or other support systems within concrete can lead to catastrophic structural failure that endangers you and your workers, and anyone else in the vicinity of your job site.
GPRS provides precision concrete scanning and imaging services designed to keep your concrete cutting and coring projects on time, on budget, and safe. Utilizing state-of-the-art ground penetrating radar (GPR) scanners and other, complementary technologies, we visualize where you can and can’t safely penetrate the slab, providing you with accurate, actionable information that helps you plan, build, and manage better.
Our SIM-certified Project Managers have achieved and maintain a 99.8%+ rate of accuracy when scanning concrete slabs for buried rebar, post tension cable, electrical conduit, and any other types of embedded obstructions that could compromise the safety and success of your project. We’re so confident in their abilities that we introduced the Green Box Guarantee, which states that when we place a Green Box within a concrete layout prior to you cutting or coring that slab, we guarantee that the area within will be free of any obstructions.
If we’re wrong, we agree to pay the cost of the damage.
From bridges to skyscrapers, GPRS Intelligently Visualizes The Built World® to keep your projects on time, on budget, and safe.
What can we help you visualize?
Frequently Asked Questions
How is GPR used to identify tendons vs. rebar in a post-tensioned slab?
In post-tensioned structures, we typically find one mat of support rebar near the base of the slab. This mat is generally consistently spaced and remains at a constant elevation.
Post-tension cables are generally found above this support mat and “draped” throughout the rest of the structure. The elevation of the cable is usually high near the beams and column lines and drapes lower through the span between beams and column lines. Knowledge of these structural differences allows us to accurately differentiate between components. Our Project Managers will leave you feeling confident in our findings and in your ability to drill or cut without issue.
What types of concrete scanning does GPRS provide?
GPRS provides two specific but different scanning services: elevated concrete slab scanning and concrete slab-on-grade locating. Elevated concrete slab scanning involves detecting embedded electrical conduits, rebar, post-tension cables, and more before core drilling a hole through the slab. Performing a concrete slab-on-grade locating service typically involves scanning a trench line for conduits before conducting saw cutting and trenching to install a sanitary pipe, water line, or something similar.
What’s Changed in the American Concrete Institute 318 Code Update?
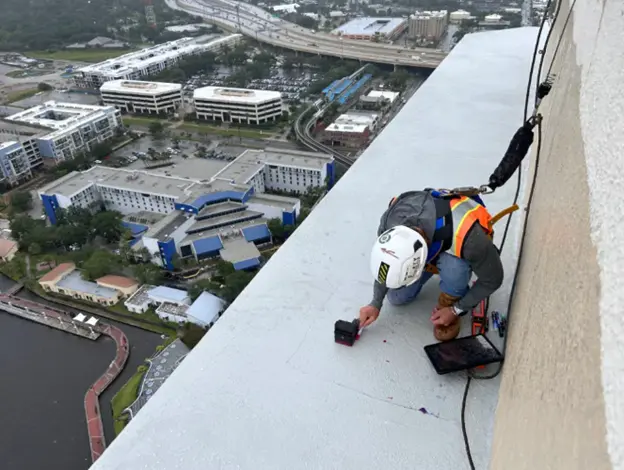
New engineering design processes, updated construction data, and the availability of innovative, sustainable materials have driven the American Concrete Institute to update is structural concrete code, known as ACI 318. The print version of the new code became available on July 9, 2025. The digital version – ACI Plus – is updated “continuously” and is also available.
“As codes evolve, so must our understanding of existing structures. GPRS plays a vital role in this process by delivering accurate subsurface and structural visualization to inform smarter, safer design modifications and rehabilitation projects.” -- GPRS Director of Reality Capture, Matt Mikolajczyk, PE (Ohio & Michigan)
What is ACI 318?
The Building Code for Structural Concrete, published by the American Concrete Institute, sets “minimum requirements for the materials, design, and detailing of structural concrete buildings, and, where applicable, nonbuilding structures.”
The organization refers to ACI 318 as its “flagship document,” arrived at “through an extensive consensus process” that covers cast-in-place, precast, shotcrete, plain, non-prestressed, prestressed, and composite construction and structural systems.
Why was ACI 318 Updated?
The last update to ACI 318 took place in 2019 (ACI 318-19). Prior to the 2019 update, the institute released regular updates approximately every three years. However, the anticipated 2022 update was scuttled when the committee instead opted to reapprove the 2019 version, (318-19 (22)), noting that the necessary updates would result in technical changes to the code itself, and that those changes would be incorporated into a subsequent wholesale update, which became ACI 318-25.
The new update, ACI 318-25: Building Code for Structural Concrete – Code Requirements and Commentary was released exclusively to ACI Plus members in the spring, and is now available for anyone to purchase.
What does ACI 318-25 Change from 318-19?
The main updates in 318-25 include:
- Seismic Design
- Shear Friction
- Deep Foundations
- Sustainability
- Performance-Based Wind Design
Seismic Design:
As is often the case, many of the changes in ACI 318-25 are to provide clarity and update existing sections of the 318 codes. New seismic design information that first made its appearance in 2019 caused a raft of clarification questions from California and the Pacific Northwest – some of the most at-risk areas for seismic activity.

“The changes in seismic design for 318-25 include a great deal of detailed clarifications on what was in 318-19. [A lot of what] we changed in 318-25 will help seismic engineers in those high seismic regions get some designs that are a little more efficient,” Greg Ziesler, senior engineer and ACI 318 committee secretary, told Engineering News-Record.
Deep Foundations:
Concrete professionals, designers, engineers, and developers will also find an expanded section on deep foundations, building on work begun in 318-19, which was the first time deep foundations were mentioned in the code, when the institute attempted to include provisions from the International Building Code. ACI 318-25 consolidates the IBC and ACI deep foundation standards into one document.
Shear Friction:
Another update provides guidance on shear friction. 318-19 prompted a federal agency to reach out regarding the roadblocks it presented, so ACI’s committee strove to clarify the standards to avoid too broad an application and to “address discrepancies,” according to Ziesler.
Structural engineers are hailing the updates to deep foundation and shear guidance, particularly the sections on pile caps and rafts on piles: included in clause 13.4.6.8 with the exemption from the size effect – under specific conditions – for two-way shear, with specifications on center-to-center spacing measurements for rafts on piles and pile caps, 13.4.6.1’s minimum edge distance and 13.4.6.3’s embedment depths for piles. Plus, a simplification of the one-way shear equation in 13.4.6.8.
And Structure Magazine cites important changes in chapter 17 & 25’s concrete anchoring specification updates. They tagged five “major updates” in anchorage:
- Updates to safety factors
- Introduction of a beneficial overturning moment term
- Beneficial separation of concrete and steel failure modes in interaction equations
- Permissible use of new Chapter 25 factors on existing reinforcement
- Clarifications on the use of reinforcing bars as anchor reinforcement
Some items in the anchoring updates are administrative – moving sections and some equations for document consistency, and others update equations for concrete failure modes, and include an important differentiation between redundant and non-redundant fastenings, “providing a capacity benefit for fastenings that are considered redundant.”
There is also a new strength-increasing factor and equation in section 17.6.2.7 regarding concrete breakout in tension to account for “the positive influence of the compressive toe of an overturning connection moment.” While related to concrete strut behavior, its function differs.
And updates to that clarify the use of reinforcing bars as anchor reinforcements allow you to omit concrete breakout calculations by replacing them with steel calculations for special reinforcing bars, and changes in 17.5.2.1.1 and 17.5.2.1.2 create anchor reinforcement subsections regarding tension and shear breakout. 17.5.2.1.3 clarifies requirements for anchor reinforcements that are not parallel to the load, and 17.5.2.1.4 gives specific requirements on when to use shear friction calculations included in section 22.9. There are also multiple changes to the connection between “concrete structural members” regarding design requirements and updated hooked-bar and headed-bar development length equations.
Sustainability:
Perhaps the most talked-about update in ACI 318-25 is the supplemental sustainability guide. Rather than provide guidance for sustainable material use and best practices, the supplement focuses on meeting state and local ordinances and requirements.
“This is more that the local jurisdiction says you must [meet] this GWP [Global Warming Potential], so how do you meet that? We now have a framework to meet those requirements,” Ziesler said.
In the supplement, you will find items about meeting low-carbon, and carbon-neutral goals in the design & planning phase. It also includes additional guidance for building more resilient concrete structures – to withstand natural disasters – and provides suggestions as to which types of structures may be best suited to do so. This guidance varies from what already exists in the code, to provide background for those planning in the maze of sustainability initiatives.
“These are different types of loads, not in the body of the code. So now if someone says you have to do this, you have a body of knowledge to do it,” Ziesler told ENR.
Materials Are Not Dismissed
While ACI-323 (part of the 318-25 update) does cover materials, specifically low-carbon concrete, ACI was searching for a way to provide sustainability guidance that did not require new standards, according to ACI’s Mike Tholen. Tholen told ENR that “We still lean on local jurisdictions to set the limits, but there are some default options in there, based on the size of the project and what sort of targets you have to meet for GWP. One reason it’s in a separate standard is that it’s not the law of the land until a local jurisdiction adopts it.”
Performance-Based Wind Design:
Like the sustainability updates, including performance-based wind design guidance is not part of the code standard, but acts as a primer for those building tall and supertall concrete structures.

The American Society of Civil Engineers (ASCE) provided a more formal “pre-standard” for the 2019 code, whereas the ACI’s appendix on the matter is less structured. For instance, it does not require wind tunnel or computer simulations, which add costs. Ziesler noted that when you’re putting a tall or supertall design in a wind tunnel, you’re most likely going to pivot to a performance-based design. ACI’s purpose in offering what ENR refers to as “an optional standard for wind,” is making sure everyone involved in a design can feel confident of its ability to perform, specifically regarding detailing requirements that would only come into play for tall and supertall construction.
“Performance-based wind design… is a response to the industry from committee members. We have a lot of committee members who do tall and supertall buildings,” Ziesler shared. It’s not an appendix to the code; it's not in main body of code; it only applies when you do it.”
GPRS’ Mikolajczyk, who is a structural engineer licensed in Ohio and Michigan, shared that, “Structural engineers need to be aware of the information contained in this concise, high-level summary of the critical updates in ACI 318-25: particularly regarding anchorage, seismic detailing, deep foundations, and sustainability considerations.”
The Building Code for Structural Concrete provides you with the specific and technical requirements, specifications, and guidelines for building with concrete. GPRS provides you with the concrete scanning, imaging, and reality capture solutions you need to cut, core, and anchor your concrete structures safely and give you the accurate as-builts you need to renovate, expand, or maintain your buildings through their entire life cycle – from preconstruction through demolition.
Concrete scanning & imaging services are just one of the ways GPRS Intelligently Visualizes The Built World® to help you plan, build, and manage better.
What can we help you visualize?
NYC’s $700M Subway Upgrades Depend on $30B Sewer Reworks
A $700 million program designed to protect New York City’s subway system from flash flooding reportedly depends on a $30 billion, multi-decade plan to upgrade the Big Apple’s aging sewer network.
According to a recent Engineering News-Record article, the Metropolitan Transportation Authority is moving forward with its $700 million program to fortify NYC’s subway system against flash flooding. This comes on the heels of a storm earlier this summer that dropped 2.1 inches of rain just one hour, overwhelming the city’s combined sewer system and flooding the subway tunnels.
According to ENR, crews pumped more than 15 million gallons overnight to restore service.
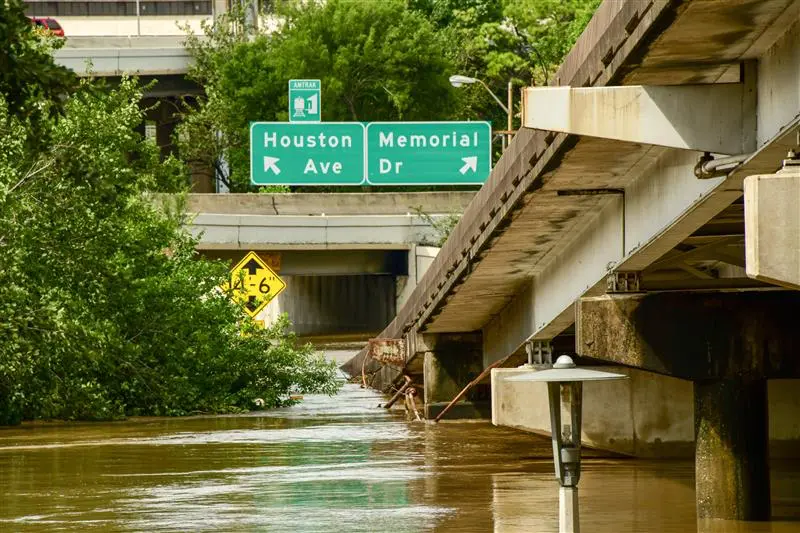
“We pump 10 million gallons on a dry day. Yesterday, we pumped like 15 million plus,” MTA Chair and CEO Janno Lieber said in a July 16 interview on local television news station NY1. “We got 2.1 inches in one hour last night. That’s when the big backups happen.”
The Difference Between Combined and Separate Sewer Systems
Most communities across the U.S. rely on separate sanitary sewer systems. In these systems, one set of pipes collects wastewater from homes and businesses and carries it to a wastewater treatment plant through sanitary sewers. While a separate set collects stormwater from drains at the ends of driveways, around parking lots, and along streets and carries it to a local waterway through municipal separate storm sewer systems.
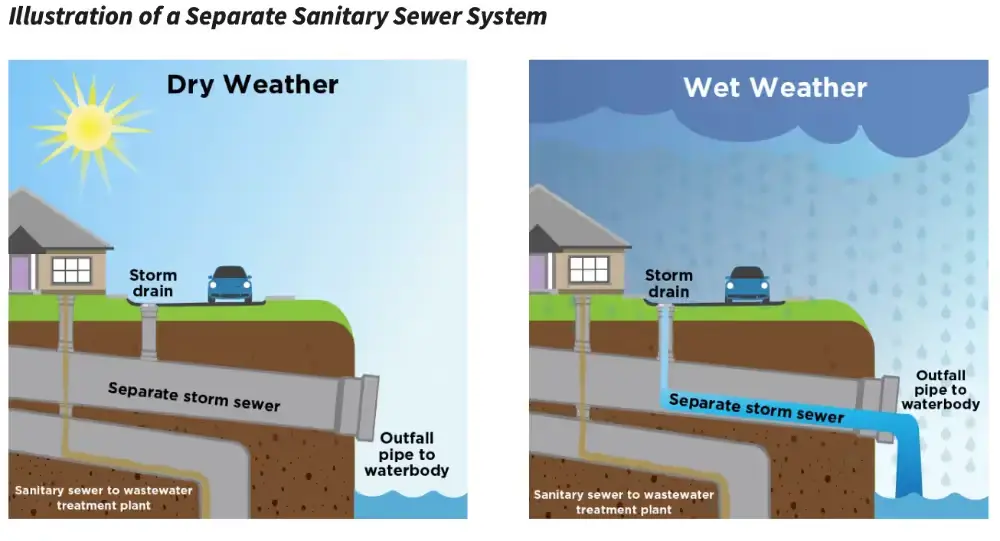
In a combined sewer system, both wastewater and stormwater flow through the same pipes. In dry weather, all wastewater flows to a wastewater treatment plant where it is treated before being discharged to a waterbody. During wet weather, however, stormwater enters the system.
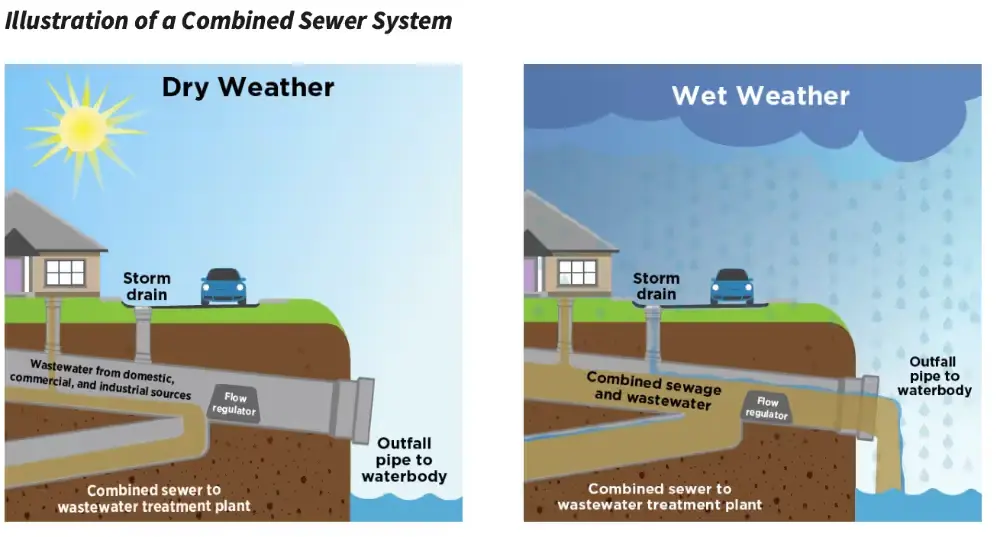
The combined flow of wastewater and stormwater can overwhelm a combined sewer system, which is why permitted outfalls are located throughout the system to act as relief points during wet weather. These outfalls discharge untreated or partially treated stormwater and wastewater into nearby waterbodies. These discharges are called combined sewer overflow (CSO) discharges, and they are a major water pollution and public health concern because they can contain bacteria, debris, and other hazardous substances that can be harmful to people, pets, and wildlife.
Approximately 700 communities across the U.S. currently rely on combined sewer systems and experience combined sewer overflow discharges, according to the U.S. Environmental Protection Agency.
Most of these communities are in the northeast and around the Great Lakes – the source of drinking water for more than 40 million people in the U.S. and Canada, and home for more than 3,500 plant and animal species, some of which are found nowhere else on Earth.
The Clean Water Act (CWA) requires communities with CSOs to put controls in place to address these concerns. But the best way a municipality can mitigate the dangers of CSOs is to overhaul their wastewater infrastructure to separate wastewater and stormwater flow.
Explaining NYC’s Plan to Fortify its Subways – and Upgrade its Sewers
The MTA’s plan to protect New York’s subways from flooding includes raising entrances at flood-prone stations, upgrading nearly 250 pumping stations and reinforcing embankments along Metro-North’s Hudson Line.
Meanwhile, the city’s Dept. of Environmental Protection (DEP) is working to manage stormwater at the street level. The DEP previously unveiled a citywide hydraulic model of its 7,500 miles of sewers, which allows engineers to simulate system performance during extreme weather and prioritize high-risk areas.
DEP estimates that comprehensive sewer upgrades, including larger mains and underground detention systems, could cost up to $30 billion. In an effort to accelerate resiliency, the agency is combining traditional gray infrastructure – traditional stormwater infrastructure in the built environment such as gutters, drains, pipes and retention basins – with green infrastructure – infrastructure such as permeable pavement, rain gardens, bioretention cells (also known as bioswales), vegetative swales, etc. that mimics nature and captures rainwater where it falls.
Nick Nyhan, founder of a grassroots neighborhood resilience effort called The City Sponge, told ENR that distributed solutions are critical alongside larger infrastructure investments.
“Even if you gave DEP $30 billion, they can’t keep up with the water,” Nyhan said. “You need individuals and neighborhoods to adopt small-scale mitigation measures—rain barrels, permeable paving, backflow valves—because the city can’t do it alone.”
“People see a bioswale or rain garden, and it’s beautiful,” Nyhan added. “That matters. Big sewer projects don’t give you that same visible payoff.”
Robert Freudenberg, Vice President for Energy and Environment at New York-based planning nonprofit, the Regional Plan Association, told the publication that coordination between the MTA and DEP, while improved, continues to be hampered by the fact that the two agencies operate under separate capital budgets. The unpredictability of flash flooding adds complexity to planning efforts, and attention is constantly being shifted away from the problem due to the cyclical nature of these events.
“…As soon as those floodwaters disappear, our focus and attention go back to other things,” Freudenberg said.
The State of America’s Stormwater Infrastructure
America’s stormwater infrastructure earned a D+ in the 2025 American Society of Civil Engineers (ASCE) Report Card for America’s Infrastructure.
This represents a modest bump from previous years, but still highlights the fact that these critical systems are largely underfunded, outdated, and increasingly vulnerable to the pressures of climate change and urban growth.
An outdated, defective stormwater system can lead to flash floods, sewer overflows, and water contamination. In its report, the ASCE noted that more than 850 billion gallons of untreated sewage is discharged annually due to combined sewer overflows.
Learn how to better maintain the water and wastewater infrastructure under your care by signing up for a free Water & Sewer Damage Awareness Week (WSDAW) presentation. Each year, GPRS’ safety experts travel across the country to speak with municipalities, engineering firms, facility managers, and property management firms about the best practices they can execute to keep these critical utilities running smoothly.
Click here to sign up for your free WSDAW presentation today!
What is the Difference Between Revit and AutoCAD?
Choosing between Revit and AutoCAD is an important decision that can impact your project’s efficiency, collaboration, and final deliverables. Each software offers distinct advantages depending on your project scope, whether you need precise 2D drafting or a comprehensive 3D model for integrated project management. Understanding the strengths of each software helps ensure you select the right solution for your project's goals and team dynamics.

What is Revit?
Revit is a Building Information Modeling (BIM) software developed by Autodesk for designing, modeling, and documenting buildings in a coordinated 3D environment. It enables architects, engineers, and construction professionals to work collaboratively across disciplines using intelligent, data-rich 3D BIM models.
What is a Revit Model?
A Revit model is a comprehensive digital representation of a building or site, created using Autodesk Revit software. A Revit model can be used throughout the building lifecycle, from design and documentation to construction and facility management.
Revit models are created by BIM Specialists, VDC Specialists, BIM/CAD Designers, Architects, and Engineers who have a degree and experience in computer-aided drafting and design (CADD) and BIM.
Each Revit model contains detailed information about all building systems, components, and infrastructure including:
- Architectural elements like walls, floors, doors, windows, and finishes
- Structural systems such as beams, columns, foundations, and load-bearing walls
- Mechanical systems including HVAC ducts, air handling units, and ventilation layouts
- Electrical systems like lighting, power distribution, and fire alarms
- Plumbing systems covering piping, fixtures, and drainage
- Subsurface utility data including public and private utilities, such as gas lines, electrical cables, telecommunication lines, sewer lines, and other buried infrastructure
- Concrete imaging data delivering structural support documentation for concrete slabs, including rebar, post tension cables, electrical conduits, potential voids, and more
A Revit model is a building information model (BIM), meaning it not only contains the 3D geometry of the building, but also includes information about every building element documenting all components, properties, materials, and the spatial relationships between them.
Unlike traditional drafting tools, Revit uses a parametric modeling approach, which means that every element in the model is interconnected. Changes made to one element in the model are automatically reflected in all related views and components, ensuring consistency and reducing errors.
Revit Families and BIM Content
Revit classifies all project components into three primary element types: model elements, datum elements, and view-specific elements. These elements are organized into families, which define both geometry and behavior.
A Revit model is built using these families.
- System families are built-in and include core elements like walls, floors, and roofs
- Loadable families are user-defined or manufacturer-specific components such as doors, windows, and furniture
- In-place families are custom elements created for a specific project context
Each element in Revit is an instance of a family type and has two sets of properties:
- Type properties apply to all instances of a family type. Changing a type property, such as wall thickness, affects every instance of that type.
- Instance properties are unique to each placed element. These control attributes like location or elevation without affecting other instances.
This family structure ensures consistency across the model while allowing flexibility for individual elements.
According to Adam Silbaugh, GPRS Senior Modeling Technician, “Revit models are rich with data – they increase collaboration across disciplines, support clash detection, and facilitate accurate quantity takeoffs, scheduling, and maintenance planning.”
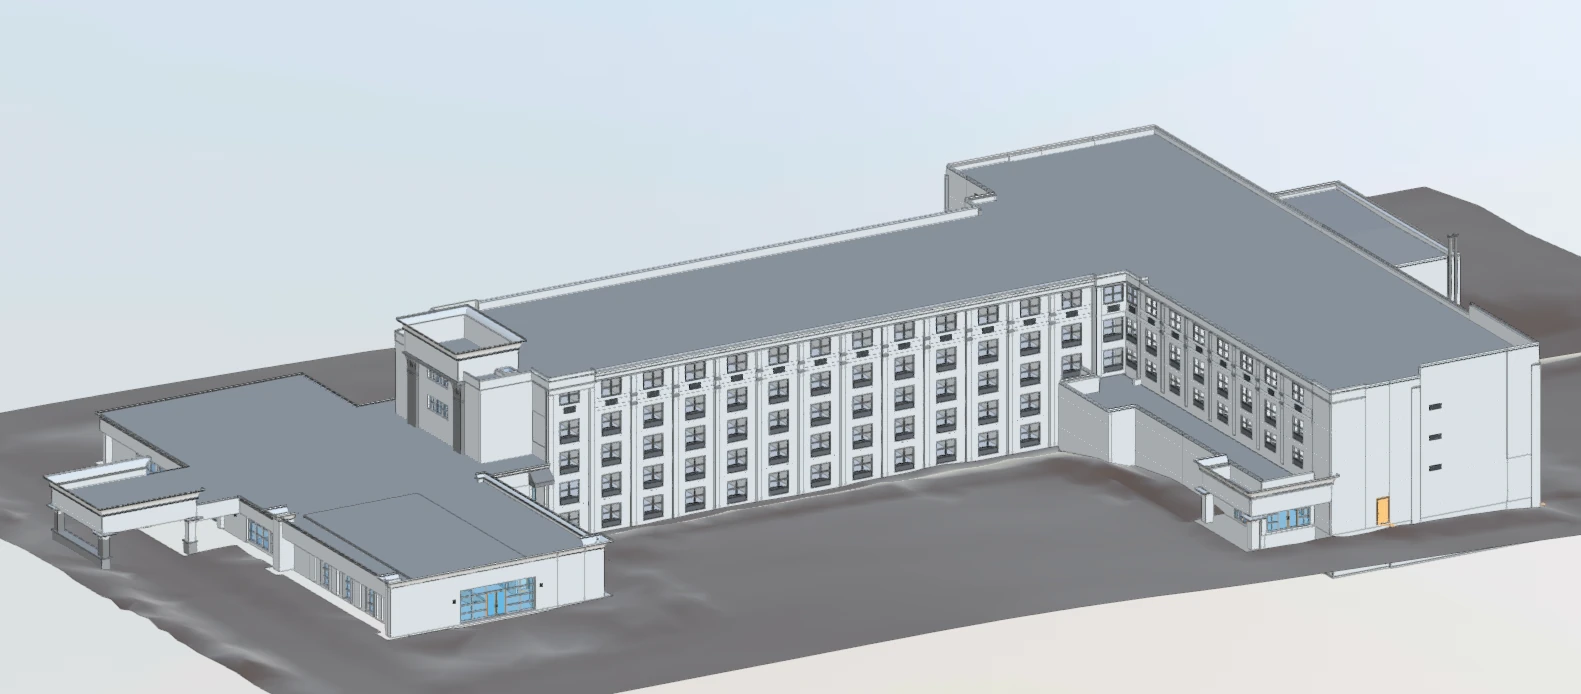

What is AutoCAD?
AutoCAD is a computer-aided design (CAD) software developed by Autodesk, used for creating precise 2D drawings and 3D models to support drafting, annotation, and design planning. AutoCAD operates on a vector-based system, allowing users to define geometry with exact dimensions and relationships. It includes tools for layer management, parametric constraints, and external references, and supports automation through scripting and APIs.
What is an AutoCAD Model?
An AutoCAD model is the digital representation of a design created within the AutoCAD environment. This model can be either two-dimensional (2D) for plans, sections, and schematics, or three-dimensional (3D) for spatial and volumetric representations. The model is composed of objects such as lines, arcs, polylines, solids, and surfaces, each defined by precise coordinates and properties. These models are typically saved in DWG or DXF file formats and can be used for visualization, fabrication, and integration into larger design workflows.
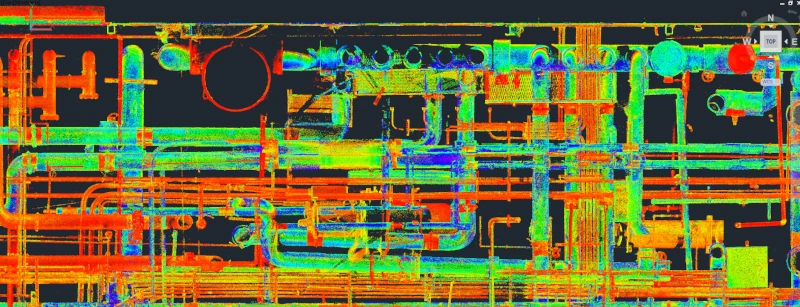
What is the Difference Between Revit and AutoCAD?
The difference between Revit and AutoCAD lies in their fundamental design philosophies and intended use cases. AutoCAD is a design and drafting software, while Revit software provides a more integrated and intelligent BIM environment.
AutoCAD is a general-purpose drafting tool that creates 2D drawings and 3D models using lines, arcs, and shapes. It is widely used across industries for tasks that require precision drafting, such as mechanical design, electrical schematics, and civil layouts. AutoCAD operates primarily in a file-based environment, where drawings are created and edited independently. Changes in one drawing do not automatically affect others unless manually coordinated.
Revit is a software built for the architecture, engineering, and construction industry. It supports BIM workflows, which means it manages not just geometry but also metadata associated with each building component. A Revit model is a comprehensive, data-driven representation of a building project that supports collaboration, automation, and analysis. Every element is part of a larger system, and changes propagate throughout the model. For example, modifying a door size in a floor plan will update the elevation, section, and schedule views automatically. This connection reduces redundancy and improves accuracy.
Another key difference is how each software handles collaboration. AutoCAD users typically work on separate files and rely on external references to coordinate drawings. This approach can lead to version control issues and misalignment between disciplines. Revit uses a central model that multiple users can access simultaneously. Changes are tracked and managed through work sets and permissions, allowing teams to collaborate in real time. This capability is essential for large projects where coordination between architecture, structure, and MEP systems is critical.
Revit also supports advanced features such as clash detection, energy modeling, and construction phasing. These tools help identify conflicts between systems before construction begins, simulate building performance, and plan construction sequences. AutoCAD lacks these integrated capabilities and often requires third-party software or manual processes to achieve similar results.
In terms of output, AutoCAD produces drawings that are primarily used for documentation. These drawings are static and require manual updates when changes occur. Revit produces models that generate drawings dynamically. Views such as plans, sections, and elevations are derived from the model and update automatically when the model changes. This approach ensures consistency across all documentation and reduces the risk of errors.
Revit also integrates with other Autodesk tools such as Navisworks, BIM 360, and InfraWorks, creating a connected platform for design, construction, and operations. AutoCAD does not offer the same level of integration for BIM workflows. It remains a powerful tool for drafting but lacks the intelligence and automation found in Revit.
For firms requiring BIM, Revit offers a more robust platform for managing complex projects. It supports lifecycle management from concept through construction and into operations. AutoCAD remains valuable for tasks that require precise control over geometry or when working in industries that do not require BIM.
Should I Choose Revit or AutoCAD?
The choice between Revit and AutoCAD depends on the specific needs of your project and your role in the design process. AutoCAD excels in 2D drafting and detailed design work, while Revit is designed for Building Information Modeling (BIM) and collaborative, large-scale projects. If your work involves detailed 2D drawings, site plans, or smaller projects, AutoCAD is a good fit. If you're working on complex, collaborative projects like commercial buildings, or if you need to leverage BIM for integrated project management and real-time collaboration, Revit is the better choice.
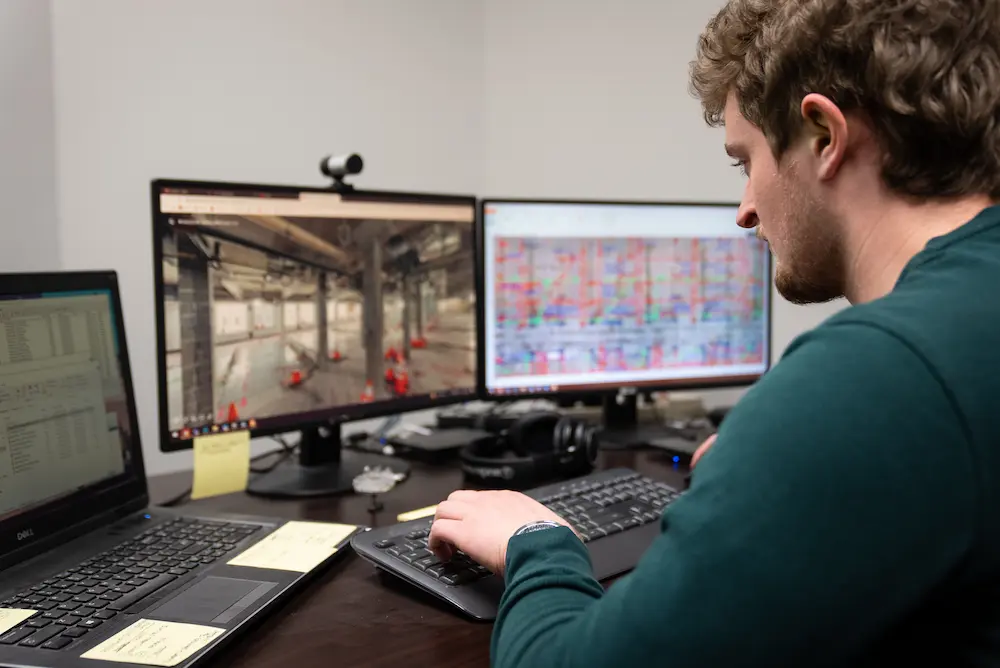
What is GPRS’ Process to Create a Revit Model?
GPRS Project Managers use high-accuracy Leica survey-grade laser scanners to capture millions of data points of a project site, creating a point cloud that represents the existing site conditions.
This point cloud data is then imported into Autodesk Revit, where GPRS's in-house Mapping & Modeling Team transforms it into a detailed 3D BIM model.
“Whether our client is designing, coordinating, or installing, our Mapping & Modeling team produces precise BIM models that align with their standards, templates, and naming conventions,” said Silbaugh.
The Revit models created by GPRS can be used for various purposes, including:
- As-built documentation: Providing a precise representation of existing structures and systems
- Design and planning: Facilitating design modifications, renovations, and construction
- Clash detection: Identifying potential conflicts between different building and MEP systems before retrofits
- Facility management: Creating a digital twin of the facility for ongoing operations and maintenance
We provide existing conditions information to support our client’s architecture, engineering and construction projects. By providing a shared, accurate digital representation of the site, Revit models enhance collaboration among project teams and stakeholders.
GPRS also integrates the Revit models and other data into our SiteMap® GIS platform, providing clients with a centralized, web-based platform for accessing and managing project information.
Whether you're planning, designing, or managing a facility, we deliver intelligent, customized 3D models in Revit or AutoCAD tailored to your project’s exact needs. Our models go beyond basic documentation, they provide the accuracy, clarity, and insight you need to make confident decisions, streamline collaboration, and reduce costly surprises down the line.
Click here to request a quote for Revit modeling services and AutoCAD modeling services.