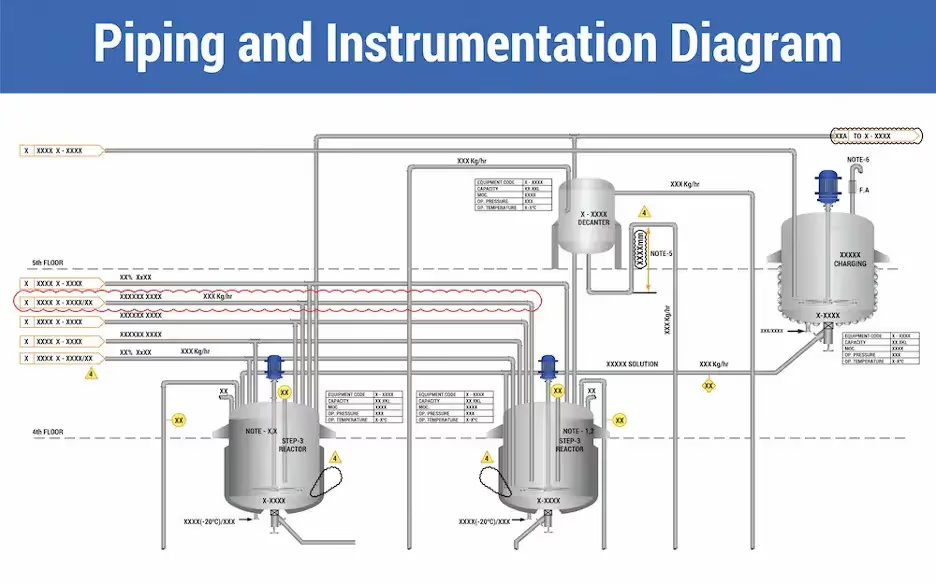
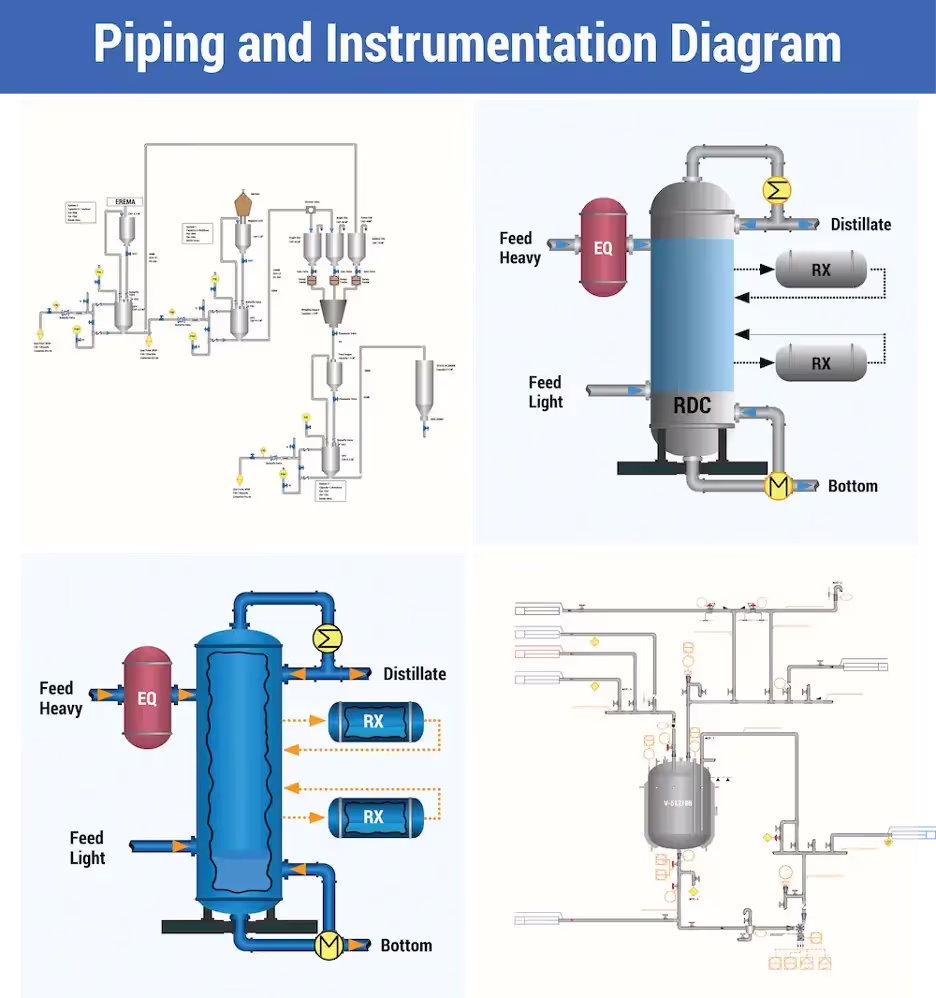
A Piping and Instrumentation Diagram (P&ID) is not just a technical drawing – it’s a graphic representation used in many industries that brings complex systems to life. Think of it as the nervous system of an industrial facility, mapping out how each part interacts, flows, and functions together. This visualization is crucial for comprehending intricate processes in sectors like manufacturing, power plants, and chemical refining.
In the world of Architecture, Engineering, and Construction (AEC), the accuracy of a P&ID can mean the difference between seamless operations and costly mistakes. But how does this seemingly simple diagram hold so much power?
Why P&IDs Matter to the AEC Industry
3D laser scanning has transformed the creation and maintenance of P&IDs by providing accurate, real-world data that enhances documentation, design precision, and system reliability. By capturing existing conditions with high accuracy, 3D laser scanning ensures that P&IDs reflect as-built conditions, reducing discrepancies between design and reality.
This technology streamlines workflows by eliminating the need for manual measurements, reducing human error, and facilitating seamless integration with CAD and BIM models.
Additionally, 3D laser scanning enhances collaboration which provides a digital representation of piping and instrumentation systems, allowing stakeholders to make informed decisions regarding system modifications, maintenance, and compliance. Engineers leveraging 3D laser scanning for P&ID development benefit from increased efficiency, improved safety, and reduced project costs.
Why Proper P&ID Design Matters
Creating precise and well-structured P&IDs is critical for ensuring operational efficiency, regulatory compliance, and overall project success. Below are the key reasons why proper P&ID design are essential:
• Enables Communication: P&IDs serve as a standardized reference for engineers, operators, and maintenance personnel, ensuring a shared understanding of system design and functionality. By providing a consistent and universally recognized format, P&IDs enhance communication and collaboration.
• Simplifies Modifications: When system changes or expansions are necessary, P&IDs provide a clear visual representation, allowing stakeholders to plan modifications efficiently. This proactive approach reduces downtime and resource spending by enabling teams to assess and implement changes without immediate physical alterations.
• Enhances Safety and Compliance: Properly designed P&IDs ensure that all components are accurately positioned and connected, minimizing the risk of errors that could lead to hazardous conditions. Additionally, well-maintained P&IDs support adherence to industry regulations and safety standards, which facilitates audits and inspections effectively.
Understanding P&ID Elements
To effectively use a P&ID, you need to understand its key components and symbols:
Equipment Symbols
Each component depicted: instruments, equipment, heat exchangers, vessels, pipe, motors, interconnecting lines, and more are represented by specific standardized symbols. Understanding these symbols is essential for interpreting the layout and function of the system.
Main Components
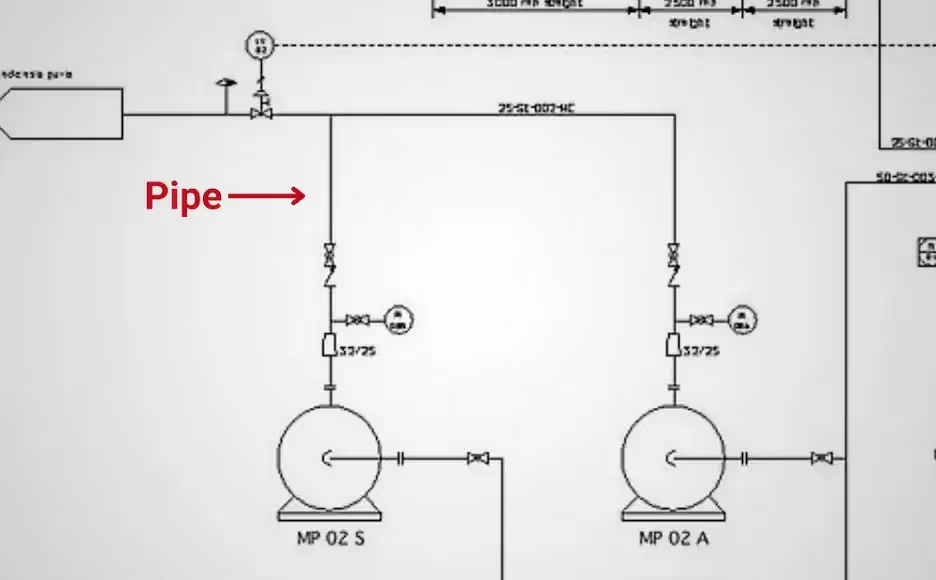
1. Piping and Flow Directions
P&IDs illustrate the interconnection of pipes using lines of varying thickness and type, representing different pipe classifications. Arrows along these lines indicate the flow direction of fluids, gases, or steam. This helps engineers and operators trace process sequences from start to finish.
• Straight Line: Symbolizes a pipeline segment
• Elbow: Shows a shift in the pipe’s direction
• Valve: Indicates a device regulating fluid flow
• Flange: Represents a joint connecting two pipes
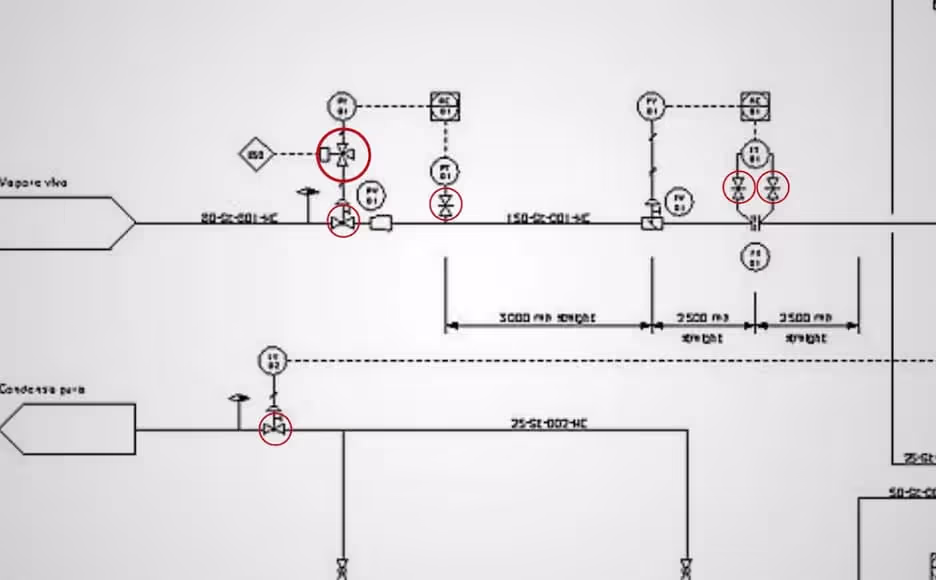
2. Valves and Fittings
Valves control the flow within the system and are represented by different symbols based on their type, such as gate, globe, ball, and check valves. This illustrates control points and connections within the system, offering a clear view of how fluids or gases are directed, regulated, and managed throughout the network. Fittings like elbows, tees, and reducers are also detailed in the diagram, demonstrating how various piping components are connected.
3. Instrumentation and Control Devices
Instrumentation is represented by unique symbols that identify pressure, temperature, level, and flow sensors, gauges, as well as controllers and actuators. Each instrument is tagged with a unique identifier that provides critical information about its function, measurement type, and location within the process.
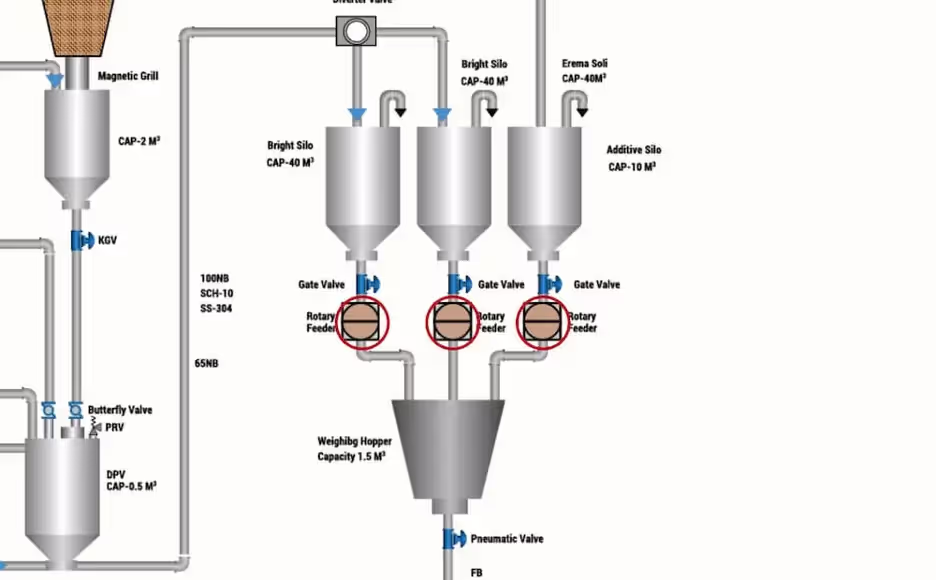
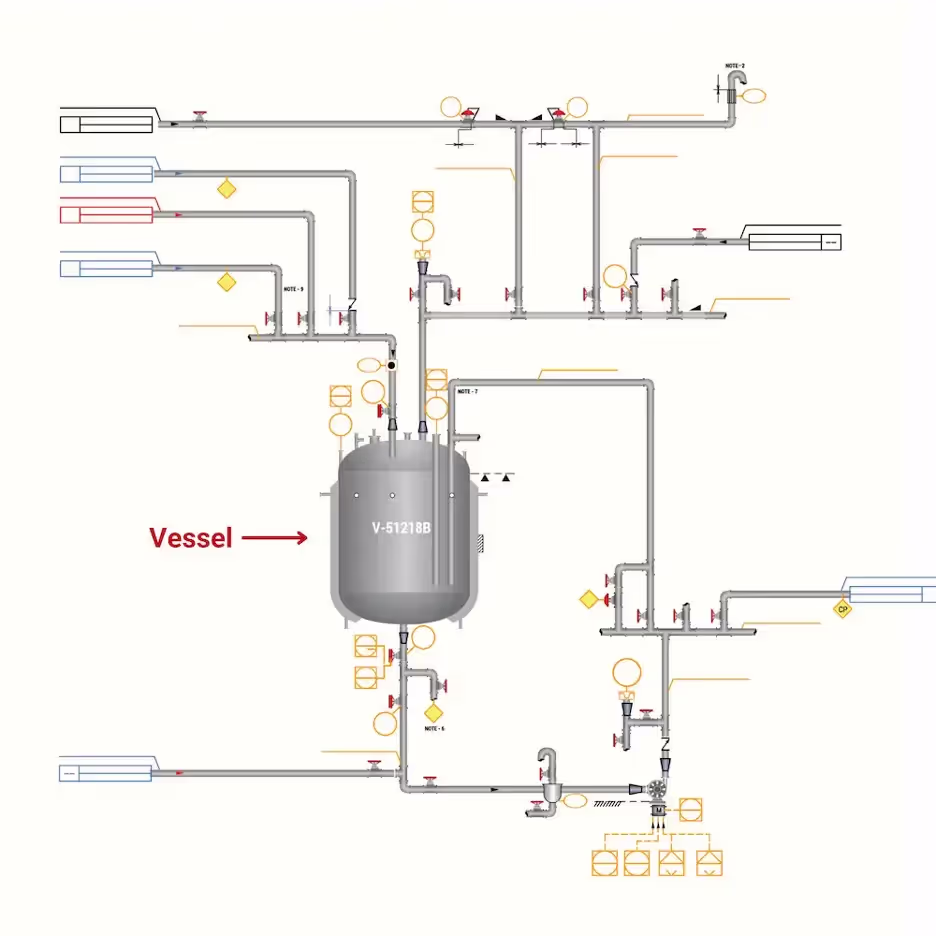
4. Tanks and Vessels
Tanks and vessels are used for storage and processing within a system. They play a vital role in maintaining process flow and ensuring that materials are available as required for different stages of production.
Creating a P&ID Using 3D Laser Scanning
As facilities change, P&IDs often become outdated. 3D laser scanning provides cost-effective and accurate way to update them.
GPRS uses LiDAR (Light Detection and Ranging)-based 3D laser scanners to capture millions of precise measurement points in a short time. Each point has x, y, and z coordinates, giving a detailed view of the facility.
With this data, engineers and facility managers can create or update P&IDs with high accuracy. This ensures design, maintenance, and compliance decisions are based on reliable information. Here’s how this technology streamlines P&ID creation and facility management:
1. Accurate As-Built Data Collection
3D laser scanning uses LiDAR-based scanners to capture detailed measurements of a facility’s piping and instrumentation in high resolution. This helps document all existing structures, connections, and system components with accuracy before a P&ID is developed or revised.
2. Conversion to 2D and 3D Models
Once a site is 3D laser scanned, the captured data is processed into a 3D point cloud, which can be converted into 2D CAD drawings or full-scale 3D Building Information Modeling (BIM) models. These models serve as the foundation for generating highly accurate and up-to-date P&IDs.
3. Reducing Errors and Improving Workflow Efficiency with 3D Laser Scanning
Traditional methods of creating P&IDs rely on manual measurements and legacy documentation, which can lead to errors. 3D laser scanning provides an accurate, existing conditions reference, reducing discrepancies to improve outcomes.
4. Integrating 3D Laser Scanning with Digital Platforms for Improved Workflow
3D laser scanning outputs can be integrated with GIS infrastructure software like GPRS’ SiteMap® (patent pending) to provide interactive, layered utility maps and updated P&IDs. This allows project teams to manage real-time data for design, construction, and maintenance workflows.
5. Streamlined Modifications and Upgrades in the O&M Phase
During the Operations and Maintenance Phase, when modifications or upgrades are required, GPRS leverages 3D laser scanning to provide a precise and reliable baseline of existing conditions. This empowers engineers to plan changes with efficiency, minimizing disruptions to ongoing operations. By integrating these updates into the P&ID, engineers gain access to accurate, as-built documentation that mirrors the actual layout of the facility. This method enhances operational efficiency, streamlines maintenance planning, and ensures that future upgrades are implemented quickly.
Maximizing Project Efficiency with Digital P&ID Integration
P&IDs are indispensable tools in the AEC industry, providing a comprehensive visual representation of process systems. The use of 3D laser scanning for P&ID creation and updates enhances accuracy and efficiency. Platforms like GPRS’ SiteMap® support better document management and accessibility, improving coordination across teams and reducing the risks associated with outdated records.
Why Choose GPRS 3D Laser Scanning and SiteMap® Services?
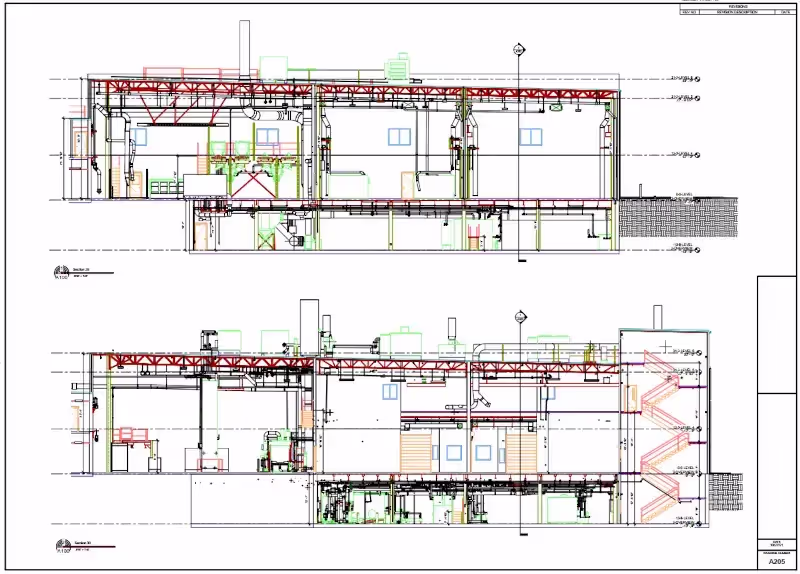
GPRS 3D laser scanning services document the exact architectural, structural, and MEP system layout and dimensions of existing buildings, facilities, and sites.
We have captured as built site conditions for water treatment plants and wastewater treatment plants from 40 MGD to 1 BGD, documenting the interior and exterior of buildings; foundations; structural, mechanical, electrical and plumbing features; equipment, motors, conduit and piping down to ½ inch diameter.
This valuable data is easily accessible to you and your team through SiteMap®, our GIS software. SiteMap® integrates as-built documentation, offering a digital platform to manage and visualize critical facility information, ensuring seamless decision-making and streamlined operations to keep your projects on-time, on-budget, and safe.
What can we help you visualize?
Frequently Asked Questions:
How do I read a P&ID?
To read a P&ID, it's important to understand the meaning of various symbols used to represent pipes, valves, equipment, and instruments. Each symbol is constructed using standardized graphical elements and connecting lines to show how components are connected and how the system operates. By familiarizing yourself with these symbols, and referencing accurate data from 3D laser scanning, you can easily interpret the flow, control systems, and components within the facility. Understanding the layout and flow paths depicted on a P&ID allows for better decision-making in design, maintenance, and operations.
Can I create a P&ID from 3D laser scanning?
P&IDs cannot be directly generated from 3D laser scan data. Instead, the initial Process Flow Diagram (PFD) is developed using point cloud data, and the instrumentation is then added through engineering expertise and research.
How does 3D laser scanning improve P&ID accuracy?
By capturing real-world data, 3D laser scanning eliminates the need for manual measurements or outdated records, ensuring that P&IDs reflect the true layout of equipment, piping, and control systems, reducing errors and discrepancies.