industry insights
Featured Articles
Is Utility Mapping Worth the Cost?
Why Do You Need Updated As-Builts on Your Next Project?
industry insights
How Power Substation Operators Can Reduce Risk and Increase Efficiency with SiteMap®
Power substations are the veins that provide the lifeblood of America’s electrical grid.
That’s why protecting them at all costs whenever construction or maintenance is occurring near them is of the utmost importance.

National Grid states that “one of the main roles of substations is to convert electricity into different voltages.” This electricity is then distributed throughout the U.S. and provides the essential energy needed to thousands of homes, businesses, and buildings to keep us going along throughout our days without interruption. It’s extremely important to prevent underground electrical line damage when installing new fencing at a major substation, as was the case in Oregon, Ohio, for a well-known national security integration provider.
Electrical Substation Maintenance, Scope of Project
The contractor hired the SIM-certified team of GPRS Project Managers who have completed over 3,000 miles of Transmission ROW scanning & over 500 substation projects nationwide for major companies such as Duke Energy, American Electric Power, Ameren, FirstEnergy and Exelon, to ensure that the electrical substation construction they were performing would move forward without any hazardous utility strikes, causing potential loss of power, electrocution, or electrification of the grid around the station.
Our scope of work at the power transmission substation was to provide accurate utility location of all underground utility lines located within ten feet of both sides of the main fence that was scheduled to be replaced. This proved to be a large project for GPRS Project Manager Vijay Gentiles, who spent an entire week accurately mapping and locating telecommunication lines, electrical lines, water hydrants, an existing sanitary sewer line, as well as the entire grounding wire grid located within the fence’s domain.
Why It Matters
Power substations are high-risk areas to break ground due to essential utilities being located throughout the majority of the system. So, the best practice is hiring a nationwide subsurface damage prevention contractor such as GPRS to utilize the most cutting edge locating and mapping protocols. In this scenario and many others like it, the substation’s as-built drawings and existing condition records were out of date and incomplete, not providing the sufficient data needed to break ground with confidence on site. Crucial duct banks needed to be protected along with essential grounding grids during installation, so Gentiles sprung to action equipped with multiple forms of cutting-edge technology, including Ground Penetrating Radar (GPR), and an Electromagnetic (EM) locator to accurately map out the proposed scan boundary for all underground utilities.
What We Discovered
While on site, Gentiles had to be extremely cautious, wearing proper PPE including fire retardant clothing per OSHA standards in case of an arc flash. As he conducted his meticulous subsurface investigation, he was able to locate both electrical and telecommunication lines throughout the entirety of the substation’s fence project. He discovered a sanitary storm line in one location, but found that it would not impact the project due to its depth.
The depths of the located lines were between two to three feet underground, while the sewer line was conveniently at a depth of five to six feet, where new fence poles being installed would not reach. After accurately mapping and marking out the lines with paint or color-coded flags, as shown in the images below, Gentiles then collected all the data with a GNSS Geode used to accurately inspect, map, and collect data points of underground utility locations. The site data was then uploaded to the cloud, and within five minutes of being collected was available within our new GIS for electric & telecommunication utilities software, SiteMap®.


The data collected by Gentiles and uploaded to SiteMap® provided an accurate below-ground digital map of the entire scan location as shown in the image below, giving a breakdown of each utility line and approximate depth where applicable.

How SiteMap® Enhances Substation Construction Safety
Every GPRS customer gets a complimentary SiteMap® Personal subscription with any GPRS utility locate project performed on their job site. This means that our customer’s superintendent was able to easily reference this accurate as-built map throughout the remainder of the fence replacement project. This gave him control to easily break down the as-built map to ensure he saw only what was needed for each leg of the project. From individual telecommunication lines as displayed in figure 2. To the entire as-built map as shown in figure 1. SiteMap® gave our customer what they needed, when they needed it, with the ease-of-use and constructability to be tailored to their needs.

Paint and flags on the ground, provided immediate visual representation of where underground lines were located on site. While SiteMap® provided an easy-to-use, geolocated, and a shareable digital utility map of all the data collected in the field by Gentiles. This information was accessible for the project superintendent on any tablet, computer, or mobile device 24/7, so that our customer was able to move forward with this electrical substation construction fence project without the frightful experience of a damaged electrical line, or a damaged grounding rod. Not only did this provide peace of mind when digging, but it ensured the project was able to be completed on budget, on time, and safe.
With GPRS’ existing condition documentation, subsurface damage prevention, and facility and property management services, you can get a suite of accurate utility as-built data, 3D building information (BIM) models, and Walkthru 3D data of your electrical substation jobsite. This will not only enable you with the accurate data you need to dig with confidence, but will give you the ability to Intelligently Visualize The Built World® above and below-ground while on your job site, in your truck, or behind your desk.
The dangers of working in and around substations are many. Mitigate them with the accurate data collected by GPRS Project Managers and provided to you via SiteMap®.
Schedule your live, personal SiteMap® demo with one of our SiteMap® experts today to learn more.
Frequently Asked Questions:
What are other ways SiteMap® Can Provide Accurate Data for My Substation Construction or Maintenance Project?
SiteMap® can aid in substation facility and project management through the use of accurate existing condition documentation technology such as 3D laser scanning and 3D photogrammetry, to provide you with accurate 3D Point Clouds, 2D CAD drawings, 3D BIM models, 3D mesh models, and much more. We’ve performed work on over 500 substations across the country, accurately locating their subsurface infrastructure below ground, and digitally mapping their existing conditions on site above ground, compiling all that data within our GIS utility software to help you plan, design, manage, dig, and ultimately build better.


How do Excavation Tolerance Zones Protect Utilities?
Failing to maintain sufficient clearance between digging equipment and underground utilities causes 13.46% of damages to buried infrastructure every year in the U.S., according to the Common Ground Alliance 2022 DIRT Report.
In every state, you must abide by federal, state, and local laws and regulations that require anyone planning to excavate near underground utilities to contact 811 or a utility locating company to have the utilities located and marked before digging begins.
Construction Safety Week (CSW) aims to connect workers and their employers with the resources they need. This annual safety initiative is May 6-10, 2024, where sponsor companies such as GPRS send their safety experts across the country to hold free presentations about a variety of safety-related topics, including tolerance zones for digging around utilities. Click here to schedule a CSW Toolbox Talk / Lunch & Learn with GPRS.
What is a Tolerance Zone?
A tolerance zone refers to the area surrounding underground utility lines where excavation work should be approached with caution to avoid damage to the utilities. A utility locating company will place markings and flags to indicate the approximate location of a buried line. The tolerance zone typically extends a certain distance from the marked location of the utility line and may vary depending on factors such as the type of utility, soil conditions, and local regulations.
Is the Tolerance Zone Different in Each State?
The size or width of the tolerance zone for digging around utilities can differ by state and may even vary within a state based on local regulations and utility company guidelines. According to the Excavation Safety Guide, states are evenly split between using 18 inches or 24 inches in their tolerance zone definitions.
To determine the total size of the tolerance zone area, contractors must know the state’s guidelines and the size of the line or pipe. For example, the total size of the tolerance zone area for a two-inch pipe in a state with a defined tolerance zone size of 18 inches would be 38 inches: 18 inches on either side of the pipe, plus the two-inch diameter of the pipe itself.

Are there Excavation Guidelines Per State?
The state also has guidelines for the methods and equipment allowed for excavation within these zones to ensure the safety of underground infrastructure and prevent damage during excavation work.
Excavators are usually required to exercise caution and use hand tools or non-destructive excavation methods within the tolerance zone to avoid accidentally damaging the utility lines, which can lead to service disruptions, safety hazards, and costly repairs. Some states only allow contractors to employ hand digging, soft digging, potholing, and vacuum excavation in the tolerance zone. They state that instruments such as pick axes, digging bars, and pointed spades should never be used.
It's essential for anyone planning to excavate near underground utilities to familiarize themselves with the relevant laws, regulations, and guidelines in their state and locality, as well as to contact a utility locating company prior to excavation. This helps to minimize the risk of damage to utility lines and ensures compliance with safety regulations.
Also, emphasizing safe digging practices, specifically within the tolerance zone, would reduce excavator errors in the field. Careful planning and adherence to safety protocols will prevent damage to underground infrastructure and ensure the safety of workers.
Many companies have comprehensive ground disturbance policies in place that helps mitigate the risk of utility strikes and damages. Ground disturbance policies typically include requirements for in-depth review and locating of utility information, and notification of community members whenever construction is going to take place. GPRS offers free ground disturbance policy reviews to help you ensure you have the procedures in place to guarantee success. Click here to request a ground disturbance policy review.

How Would a Contractor Excavate Around Utilities?
Before any excavation work begins, the contractor must contact the relevant utility locating company to request utility locating services. These services involve using ground penetrating radar equipment to detect and mark the location of underground utilities, such as gas lines, water pipes, electrical cables, and telecommunications lines.
Here are the main elements that must be considered when creating or following a dig policy.
Utility Locating: Calling 811 before you dig is the law, and One Call will connect you with public utility contractors who will provide you with the location of all public utilities near your excavation. One Call cannot provide locates for the private utility lines on site, nor do they provide depths for public utility lines. GPRS professional private utility locating can locate both public and private utilities, provide accurate field markings, including depths, and give you complimentary digital and PDF utility maps of your utility infrastructure.
Review Utility Maps: The contractor will review utility maps or as-built drawings to get an idea of the location and depth of underground utilities in the area.
Define Tolerance Zone: Once the utilities are located and marked, the contractor identifies the tolerance zone.
Non-Destructive Excavation: Within the tolerance zone, the contractor may use hand tools or non-destructive excavation methods, such as hydro excavation or vacuum excavation, to carefully expose the utilities. These methods minimize the risk of accidental damage to underground infrastructure.
Visual Inspection: As the excavation progresses, the contractor visually inspects the exposed utilities to verify their type, condition, and depth. This information helps ensure that excavation activities proceed safely without causing damage to the utilities.
Temporary Support: The contractor may provide temporary support or protection for exposed utilities to prevent damage during the excavation process. This could involve shoring, bracing, or other protective measures.
Excavation Equipment and Techniques: Depending on the nature of the project and the size of the excavation, the contractor may use a variety of excavation equipment and techniques, such as backhoes, excavators, trenchers, or hand digging tools. Care must be taken to avoid striking or damaging the marked utilities during excavation.
Monitoring and Compliance: Throughout the excavation process, the contractor monitors the work area for any signs of utility damage or safety hazards. Compliance with safety regulations and best practices is essential to minimize the risk of accidents and ensure the integrity of underground infrastructure.
By following these steps and exercising caution and diligence, contractors can safely excavate around utilities while minimizing the risk of damage and ensuring the success of the project.

Why Choose GPRS? The GPRS Difference.
When it comes to construction and facility management, every decision you make can cost time, money, and even lives. GPRS is in pursuit of a world with 100% subsurface damage prevention. Our 99.8% accuracy rate for ground penetrating radar services (GPR), utility locating services, and utility mapping services will locate critical underground utilities to help keep your project on time, on budget, and safe.
GPRS has an extensive nationwide network of highly trained and experienced Project Managers in every major U.S. market. When clients hire GPRS, they have the peace of mind of knowing that they have the most reliable ground penetrating radar and electromagnetic locating technology on their job site, and they'll receive the assistance of a Project Manager who can provide them with the most accurate data. For over two decades, GPRS has been the industry leader by providing outstanding service and cutting-edge technology, keeping projects on time, on budget, and safe.
What can we help you visualize?
Frequently Asked Questions
Are all underground utility lines buried at the same depth?
The depth of utility lines can vary depending on the type of utility on site. For example, cable and telephone lines in a conduit are typically buried one foot or less underground.
What is the dig alert tolerance zone?
If you are digging within 18-24 inches of the outside diameter of the utility (or tolerance zone), you are required to utilize hand tools only. Any underground facilities that are in conflict with your excavation must be located with hand tools and protected before power equipment is used. GPRS offers free ground disturbance policy reviews to help you ensure you have the procedures in place to guarantee success.
What is a vacuum excavation?
Vacuum excavation is a non-mechanical and less invasive method of excavation. A blast of air or water is first directed into the dig site to loosen soil and break up any large materials. It is categorized as air or hydro vacuum excavation depending on how the soil is broken down.
How Can Laser Scanning and BIM Assist MEP Contractors?
The Basics of MEP Installation
Mechanical, electrical, and plumbing (MEP) installation involves a series of highly coordinated steps performed by contractors to integrate their systems into a building's structure. Throughout the installation process, contractors prioritize safety, quality, and code compliance to ensure that MEP system installations are performed safely, function properly, and are reliable for the life of the building.
Before installation begins, a general contractor would need up to date as-builts to develop MEP design plans. If existing conditions documentation does not exist or is not up to date, then the contractor would reach out to a 3D laser scanning company to scan the site and deliver accurate as-builts. Precise building layouts, dimensions, elevations, and distances ensure the successful planning and installation of MEP systems.
A general contractor would also need the locations of underground utilities (e.g. gas lines, water pipes, electrical cables, etc.) for planning and safety purposes. They would reach out to a utility locating company to conduct on-site investigations and receive up-to-date utility maps.
They will utilize comprehensive site information to plan MEP routes and coordinates with trades. Once planning is complete, the trade contractors will prepare the construction site for MEP installation by clearing obstacles and double checking that MEP systems are routed around utilities to ensure a safe working environment. They may also install temporary supports or scaffolding as needed.
Next, they will rough-in the basic framework and components of MEP systems before finishing materials are applied. Rough-in installation includes:
- HVAC Mechanical: Ductwork, air handlers, vents, and other HVAC components are installed according to the design layout.
- Electrical: Conduit, wiring, panels, and distribution equipment are installed to deliver power throughout the building.
- Plumbing: Pipes, fixtures, valves, and pumps are installed to supply water, gas, and drainage systems.
Throughout the installation process, contractors coordinate closely with other trades to ensure that MEP systems integrate seamlessly with structural elements, architectural features, and other building systems.
Once the rough-in installation is complete, contractors conduct tests and inspections to verify the functionality of MEP systems. After passing inspections, contractors complete the final installation of MEP components and make any necessary adjustments.

How Do Contractors Capture Existing Site Conditions?
Having accurate as-builts prior to MEP design planning will ensure smooth integration and installation of MEP systems with the existing building design. This is accomplished by 3D laser scanning the site.
3D laser scanners use LiDAR (light detection and ranging) technology to capture millions of three-dimensional data points of a space. Each data point is converted into a pixel with an XYZ coordinate. Millions of data points are captured and processed into a point cloud, creating an accurate 3D as-built data set of the site. The technology delivers highly accurate digital layouts and dimensions for construction professionals.
What Benefits Can 3D Laser Scanning Provide for MEP Contractors?
3D laser scanning captures as-built site conditions, assists with clash detection, optimizes spatial planning and layout, verifies system installation, and provides progressive documentation for MEP contractors.
Accurate As-Built Documentation: Laser scanning accurately captures the existing conditions of a building or site, providing detailed as-built documentation. This information ensures that MEP systems are designed and installed to fit precisely within the existing structure, minimizing clashes and rework.
Clash Detection: Laser scanning produces point clouds that can be overlaid on top of MEP design models. This provides data for general contractors to perform clash detection and identify conflicts between MEP systems and other structural and architectural building elements. By detecting clashes early in the design phase, costly on-site conflicts and revisions are minimized.
Spatial Planning and Layout Optimization: Laser scanning provides precise measurements of available space, enabling MEP engineers to optimize the layout of systems for efficient use of space and minimal interference with other building elements. This optimization can lead to more cost-effective designs and streamlined installation processes.
Upgrades or Modifications: 3D laser scanning captures precise details of existing equipment and MEP features so that upgrades or modifications can be tied into existing systems and installed with confidence, fitting seamlessly into the existing space.
Construction Verification: During construction, laser scanning can be used to verify that MEP systems are being installed according to design specifications. By comparing scan data with the design models, any deviations or discrepancies can be quickly identified and addressed.
Progress Monitoring and Documentation: Laser scanning can be used to monitor construction progress over time, providing a visual record of MEP installation at various stages of construction. This documentation can be valuable for project management, quality assurance, and ongoing maintenance.
3D laser scanning enhances the efficiency, accuracy, and coordination of the MEP installation process, improves construction workflows, and increases the quality of MEP systems.

How is a 3D Building Information Model/Building Information Management Model (BIM) Created?
Once a site is 3D laser scanned, a 3D building information model (BIM) can be created from the point cloud data. A 3D BIM model provides a geometrically accurate model of a building or site, capturing spatial relationships, infrastructure and manufacturer details, property and layer information, and other pertinent aspects of the site. A 3D BIM model provides general contractors with the ability to break down building parts by elements or layers and see how they fit into a single finalized structure. General contractors can isolate walls, columns, windows, doors, etc., and plan for MEP installation.
What Benefits Can BIM Models Provide for MEP Contractors?
A BIM model can provide these benefits for MEP system installation.
Design Planning: 3D laser scan data can be used to create detailed 3D BIM models of MEP building systems, including ductwork, piping, conduit, and electrical systems. These models provide a clear visual representation of how MEP components will fit within the existing building structure.
Clash Detection: Clash detection tools within BIM software help identify conflicts between MEP systems and other building elements, enabling early resolution of clashes to prevent costly rework during installation.
Coordination: A 3D BIM model provides a digital twin that improves communication and collaboration between different disciplines involved in the construction process, including architects, structural engineers, MEP engineers, and contractors. By working within a shared BIM environment, the project team can collaborate more effectively, share information, and coordinate their efforts to ensure that MEP systems integrate seamlessly with the overall building design.
Quantity Takeoff and Cost Estimation: BIM software can generate accurate quantity takeoffs and cost estimates for MEP components based on the 3D model. This helps MEP contractors plan and budget their installations more effectively, reducing the risk of cost overruns and ensuring that materials are ordered in the appropriate quantities.
Prefabrication: BIM enables MEP engineers to design systems for prefabrication off-site. With detailed BIM models, engineers can accurately plan the fabrication of MEP components in a controlled environment, improving quality control and reducing installation time and labor costs on-site.
Construction Sequencing: BIM can be used to aid construction sequencing for MEP system installation. By visualizing the MEP installation design plan in a virtual environment, contractors can optimize their workflows, ensure workers’ safety, and identify issues before installation.
Facilities Management: BIM models can be leveraged for facilities management purposes after construction is complete. By incorporating information about MEP systems into the BIM model, facility managers can access valuable data about equipment location, and maintenance schedules, streamlining operations and maintenance activities throughout the building's lifecycle.
Finish Drawings: A 3D BIM model can provide a record of the final state of the project, documenting any changes or deviations from the original plans or specifications that occurred during the construction process. This provides a reference for building owners, facility managers, and maintenance personnel to understand the layout, configuration, and components of the completed structure. This information is valuable for ongoing maintenance, repairs, and future renovations.
3D BIM models are revolutionizing MEP system installation, adding intelligence, efficiency, and safety to project execution.

The GPRS Difference. Why Choose GPRS?
As the leading provider of 3D laser scanning and BIM modeling services, we revolutionize mechanical, electrical, and plumbing (MEP) design processes. Our laser scanning captures precise measurements of existing structures, while our BIM modeling integrates this data for accurate visualization and coordination of MEP elements. This ensures optimal spatial layouts, enhances efficiency, and minimizes errors and rework, delivering superior results for our clients' projects.
GPRS supports MEP installation projects nationwide, with extensive experience in 3D laser scanning and utility locating. Our elite Project Managers utilize Leica laser scanners, ground penetrating radar, and electromagnetic locators to gather as-built site conditions. Data is then compiled into custom utility maps, 2D CAD drawings, and 3D BIM models by our in-house Mapping and Modeling Team and delivered via SiteMap®. SiteMap® is a free cloud-based software that delivers georeferenced utility data, CAD files, BIM Models, all in one platform.
What can we help you visualize?
Frequently Asked Questions
How Long Does 3D Laser Scanning Take?
An individual scan usually takes between 1-2 minutes. The Project Manager will set up the scanner in multiple positions around the building or site. Most building scanning projects can be laser scanned in as little as a couple of hours or larger sites in a few days. Entire facilities or campuses can take several weeks to capture the entire site, but most projects are scanned in a few hours or one day.
How Much Does 3D Laser Scanning Cost?
The cost of 3D laser scanning a building or site depends on the size and complexity of what is being scanned. 3D BIM modeling costs are based on the size of the area being modeled, level of detail, and features needing to be included. 3D laser scanning can bring tremendous cost savings to a project. Quality data can lead to a faster design process and fewer change orders, ultimately saving time and money.
Is BIM Just for Large Projects?
No. Building Information Modeling (BIM) should not be restricted to large and complex projects. Comprehensive site information brings value to every project. BIM management will expedite planning, improve workflows, and increase collaboration — which means that implementing BIM laser scanning will lead to cost and time savings, regardless of the project scale and complexity.
How Recycled Foamed Glass Aggregate Could Change the Game for Infrastructure Construction
More than half a billion glass bottles… That’s how much glass a Pennsylvania firm has reclaimed from landfills and turned into an unusual construction material: recycled foamed glass aggregate, an ultra-light type of mechanically stabilized earth (MSE) that is gaining popularity for its insulating properties and environmental benefits.
Assuming an average weight of eight ounces each, those 500 million glass bottles have an approximate weight of 125,000 tons and could circle the Earth three times. So, we’re talking about a lot of recycled glass.
Innovative materials are a cornerstone of progress in construction productivity, enabling faster, more efficient, and more sustainable practices. Recycled foamed glass aggregate is gaining popularity for its lightweight, insulating properties and environmental benefits, as it shows off its unique properties to speed construction efforts, particularly in infrastructure projects like roads and highways.
What is Recycled Foamed Glass Aggregate?

Recycled foamed glass aggregate is made from post-consumer recycled glass, such as bottles and other glass products. The production process begins by grinding the glass to a powder, which is then mixed with a foaming agent, typically silicon carbide. This mixture is heated in a kiln, where the foaming agent reacts to the heat, creating millions of tiny bubbles within the glass, transforming it into a highly porous, lightweight material. Once cooled, this material is crushed into aggregate sizes that can be used in various construction applications like widening roadways, acting as fill under concrete slab foundations, and insulating electrical transmission lines, among others. The EPA gave the material the green light back in the 1980s, but it has just recently been gaining traction and has been approved for use in more than 22 states in the U.S.
Applications in Construction
The primary application of foamed glass aggregate is in construction projects where weight reduction on underlying structures is crucial. It is an excellent fill material for highway expansions, providing a solid yet lightweight substrate that can support heavy loads without compromising the integrity of existing underground utilities. The material’s light weight reduces the stress on underlying structures, making it ideal for projects over sensitive areas, such as water pipes and sewage systems.
The aggregate is also used extensively as backfill for retaining walls and as a base layer for roadways and foundations. Its drainage properties, resistance to weather conditions, and portability, coupled with its mechanical stability, can make it a solid choice for fill in areas prone to water retention and flooding.
Rather than requiring eight-inch lifts like topsoil or fill, the aggregate can be placed in 24-inch lifts, so you get faster vertical build, with much less compaction required and no need to wait for optimal moisture conditions before adding weight.
According to Aero Aggregates of North America, LLC’s CEO, Archie Filshill, you can “take away two feet of soil, install 12 feet of foamed glass, with no additional weight. It’s a six to one conversion.”
Environmental Impact & Sustainability
One of the most compelling aspects of recycled foamed glass aggregate is its contribution to environmental sustainability. The use of recycled glass helps divert waste from landfills and reduces the demand for virgin raw materials. Moreover, the energy required to produce the MSE is significantly lower than that required for traditional fill materials like crushed stone or sand.
And an unusual property of the material is that it can be easily deconstructed and repurposed into another construction project by simply scooping it out of its location and placing it at its next one, with no other reclamation processes required.
Insulating Properties and the R-factor
Recycled foamed glass aggregate is a closed cell foam, so it has an R-factor value of 11.5 to 15.7 and boasts excellent insulating properties. The R-factor indicates the material's resistance to heat flow; the higher the R-factor, the better its insulating capabilities. In the context of infrastructure, using glass aggregate can help improve the energy efficiency of buildings and roads by providing a thermal barrier. This is particularly beneficial in utility insulation, where maintaining temperature control is crucial, which is why it has been used as insulation for power transmission lines without fear of damage.
Impact on Highway Expansion & Construction
The lightweight nature of foamed glass aggregate has made it a game-changer in highway expansion and construction projects. It allows for the rapid deployment of infrastructure without the need for extensive groundwork or reinforcement that heavier materials might require. This was notably demonstrated in the rapid repair of Philadelphia’s I-95, where it was used to stabilize the ground swiftly and effectively, allowing the highway to reopen in record time after a catastrophic collapse caused by a fire.

Integration with Concrete Construction
The lightweight material can also be integrated into concrete construction as a lightweight aggregate and insulator. This integration not only reduces the overall weight of the concrete but also enhances its thermal and acoustic insulating properties. Its use in concrete is advantageous in urban settings where noise reduction and energy efficiency are priorities. For example, you can place a foot of aggregate instead of layers of stone and Styrofoam under a slab, and achieve a similar R-factor, with significantly less weight.
From a construction safety & utility infrastructure mapping perspective, the aggregate “reads” much like a layer of gravel for ground penetrating radar (GPR) and EM locators, so there is no concern about it interfering with subsurface utility as builts or mapping.
Future Prospects & Innovations
The future of recycled foamed glass aggregate in construction looks promising, with ongoing research and development aimed at enhancing its properties and expanding its applications. Innovations in the composition and manufacturing process could see it becoming a standard material in even more areas of construction and civil engineering.
Overall, this material signifies a significant step forward in the quest for more sustainable and efficient construction materials. Its unique properties, such as the R-factor and utility insulation capabilities, combined with its environmental benefits, make it a potentially valuable asset in modern construction, particularly in infrastructure projects like highway expansion and concrete construction. As the construction industry continues to evolve, the role of innovative materials like this will undoubtedly expand, paving the way for more sustainable and resilient infrastructure development.
Frequently Asked Questions
How does ground penetrating radar find underground utilities?
Ground penetrating radar (GPR) is one of multiple technologies that are used to find and map underground utility infrastructure. At GPRS, we use it along with other complementary technologies as part of the Subsurface Investigation Methodology (SIM) to achieve an industry-leading 99.8%+ accuracy rate for utility locating. Read about the technical side of GPR here.
Does ground penetrating radar penetrate concrete?
Yes, it does. In fact, GPR is one of the main technologies used to assess the interior of elevated concrete slabs. While it cannot be used as a structural analysis tool, it can, the hands of a professional concrete imaging specialize, map the entire interior of your concrete slab reinforcements, the data from which GPRS can use to provide an accurate 3D BIM model of post-tensioned, pan deck, or other types of concrete slabs.
Strategic Mapping for Enhanced Infrastructure Asset Management: The Role of SiteMap® and GIS
GIS has become an indispensable tool for effective infrastructure asset management, crucial for maintaining the reliability, sustainability, and resilience of urban systems.
Whether it's underground utilities, transportation networks, or public facilities, managing these infrastructure assets demands thorough planning, monitoring, and maintenance strategies. And SiteMap® (patent pending), powered by GPRS, is revolutionizing this field.
Understanding Infrastructure Asset Management Challenges
Infrastructure assets, including critical underground systems like water and sewer lines, electrical cables, and telecommunications networks, are the backbone of modern urban environments. However, their management is fraught with challenges:
Complexity and Interconnectivity: The intricate web of interconnected underground utilities increases the risk of conflicts and safety hazards during construction and maintenance, especially where public and private networks overlap.
Aging Infrastructure: Many urban centers struggle with outdated infrastructure, where some utilities are decades or centuries old. Proactive maintenance strategies and continuous assessment are vital for ensuring these systems' longevity and functionality.
Regulatory Compliance: Navigating the complex landscape of regulations governing infrastructure management is crucial to avoid legal liabilities, fines, and penalties.
Data Fragmentation: Often, infrastructure asset data is scattered across various formats and sources, making it challenging to achieve a cohesive understanding of the assets.

The Role of Digital Utility Mapping and GIS
Digital utility mapping and GIS are potent tools that address these management challenges. By merging spatial data with detailed attribute information, GIS enables the visualization, analysis, and management of infrastructure assets within a geospatial framework. SiteMap®, a leading underground utility mapping software, utilizes GIS technology to provide comprehensive asset management solutions.
Key Benefits of SiteMap® and GIS Integration:
Accurate Utility Mapping: SiteMap® offers high-resolution, layered digital maps that accurately show the location, depth, and type of underground utilities, significantly reducing the risk of conflicts and damage during excavation.
Comprehensive Asset Inventory: As both a GIS database and an integration platform, SiteMap® maintains detailed records of infrastructure assets, including material type, installation dates, and condition, facilitating effective lifecycle management and maintenance prioritization.
Spatial Analysis for Decision Making: Advanced GIS tools enable spatial analysis, helping to identify patterns and relationships within the data, thus supporting strategic decisions such as site selection and route optimization.
Enhanced Visualization and Collaboration: GIS-based tools improve communication among stakeholders by providing interactive, detailed visual representations of subsurface utilities, which aids in planning and consensus building.
Going Beyond the Surface
Digital Utility Mapping: SiteMap®’s software acts as a single point of reference for utility data, supported by the precision of GPRS’s on-the-ground data collection.
We offer KMZ and PDF maps with every utility locate, plus a complimentary SiteMap® Personal subscription to GPRS clients. Our team can produce everything from simple GPS maps to detailed 2D CAD drawings and 3D Building Information Models (BIM) tailored to your project’s needs.
Asset Inventory Management: SiteMap® centralizes asset data storage, providing a comprehensive database that can include extensive details on each piece of infrastructure.
Stakeholder Engagement: SiteMap®’s visualization tools enable effective public outreach and stakeholder engagement, facilitating access to crucial project information and enhancing collaboration across platforms.
SiteMap® stands as a transformative force in infrastructure asset management, especially for underground utilities. By leveraging digital utility mapping and advanced GIS tools, organizations can obtain unparalleled insights into their assets, optimize maintenance regimes, and improve stakeholder involvement. As urban areas continue to develop, the integration of SiteMap® and GIS will be critical in creating sustainable, resilient, and technologically enhanced infrastructure systems for the future.
GPRS SiteMap® team members are currently scheduling live, personal SiteMap® demos. Click below to schedule your demo today!
Managing the Unseen: Unlocking Potential with SiteMap®-enabled Underground Utility Mapping Software
With the introduction of sophisticated technologies like SiteMap®—an all-encompassing underground utility mapping software—organizations can now leverage the potential of these hidden assets, substantially lowering repair and maintenance durations, damages, and costs.
The Importance of Digital Utility Mapping
Digital utility mapping, also known as underground utility mapping, involves the precise mapping and management of underground utility networks using cutting-edge technologies such as Geographic Information Systems (GIS), Global Positioning Systems (GPS), and ground-penetrating radar (GPR). This technique is valuable across multiple sectors, including construction. The advantages of this method for infrastructure management are manifold:
Increased Precision: Digital utility mapping facilitates the creation of extremely accurate maps of underground utilities, diminishing the likelihood of errors and inaccuracies found in traditional mapping techniques.
Improved Safety: Precise mapping of underground utilities reduces the risk of unintended damage during excavation and construction activities, decreasing the chance of utility strikes and related safety issues.
Cost Reduction: Digital utility mapping helps avoid expensive repairs and downtime caused by utility strikes, offering significant cost reductions for organizations.
Efficient Planning and Maintenance: With access to current information about the location and status of underground utilities, organizations can plan maintenance tasks more effectively, extend the lifespan of assets, and reduce service disruptions.

SiteMap®: The Leading Software in Underground Utility Mapping
SiteMap® is a leader in digital utility mapping, providing specialized software solutions designed for infrastructure managers, engineers, and contractors. The SiteMap®-enabled software blends innovative technology with user-friendly interfaces, delivering comprehensive management and mapping functionalities for underground utilities.
Principal Features of SiteMap®
Integrated Data Collection: SiteMap® integrates data from GPRS’ CCTV pipe inspections, 3D laser scanning, utility locating, concrete scanning, and leak detections. This information is consolidated on our platform, establishing a unified source of accurate, up-to-date underground utility data. While functioning as a standalone GIS platform, SiteMap® also supports data transfer with most other GIS applications.
Detailed, Layered Mapping: SiteMap® produces detailed, interactive, layered maps of underground utilities, enabling users to see the exact location, depth, and type of utility lines crucial for precise planning and decision-making.
Fast, Reliable Updates: SiteMap® offers quick and dependable updates on underground utility networks, keeping users informed about changes in utility status, maintenance works, and potential risks. Once GPRS completes your location job, the data is promptly uploaded to your SiteMap® dashboard, typically within minutes.
Customizable Visualizations: SiteMap® allows for tailored visualization tools that enable users to overlay utility maps with additional contextual data like land use patterns, environmental conditions, and property lines. This multi-faceted approach boosts planning and analytical capabilities.
Risk Assessment and Mitigation: SiteMap® comes equipped with the necessary data for users to conduct risk assessments and pinpoint potential dangers associated with underground utilities, such as corrosion, leaks, or proximity to excavation sites. This proactive stance helps minimize disruptions and promotes the safety of infrastructure projects.
Empowering Organizations with SiteMap®
Implementing SiteMap® mapping software can revolutionize infrastructure management practices and yield numerous advantages for organizations:
Enhanced Safety
Precise mapping of underground utilities minimizes the risk of utility strikes during excavation and construction activities, safeguarding workers and the public. According to the Common Ground Alliance, an estimated 213,792 unique reported damages occurred in 2022 in the United States, with some resulting in fatalities. Accurate mapping can significantly reduce these incidents.
Greater Efficiency
Real-time access to underground utility information allows organizations to plan maintenance activities more efficiently, reducing downtime and minimizing service interruptions. The American Society of Civil Engineers reports that the United States incurs an estimated $97 billion annually from water main breaks, rating our infrastructure a C-. Digital utility mapping can mitigate these losses by enabling proactive maintenance and repair.
Cost Reduction
By reducing utility strike risks and optimizing maintenance operations, SiteMap® can achieve substantial cost savings for organizations. The Federal Highway Administration notes that the average utility strike costs $4,000, potentially escalating to between $14,000 and $56,000 depending on damage severity and service impact.
Environmental Stewardship
Accurate mapping of underground utilities helps prevent environmental damage from utility strikes, such as soil contamination and water pollution. By diminishing the likelihood of such incidents, SiteMap® supports sustainable infrastructure development and conserves natural resources.
SiteMap® stands as a vital tool in unlocking the potential of underground utilities and enhancing infrastructure management practices. By delivering precise mapping, timely updates, and advanced analytics capabilities, SiteMap® empowers organizations to enhance safety, efficiency, and cost-effectiveness in managing underground infrastructure.
As organizations increasingly adopt digital solutions in infrastructure management, SiteMap® is poised to play a pivotal role in shaping the cities and communities of tomorrow.
GPRS SiteMap® Team Members are currently scheduling live SiteMap® demos. Click below to schedule yours today!
Is Waterless Concrete Part of the Construction Industry’s Future?
Sustainability is a significant concern in the construction industry, driving innovation in materials and methods.
One such groundbreaking development is waterless concrete, a new formulation designed to address environmental concerns while maintaining the strength and durability essential for modern construction.
That idea is being taken to new heights – literally – as part of a project designed to test new lunar construction materials in preparation for NASA’s planned 2025 return to the moon.

According to a press release on Louisiana State University’s website, LSU and scientists from NASA Marshall Space Flight Center in Alabama have partnered to research the use of native raw materials readily available on the surface of the Moon and Mars – namely sulfur and regolith – to develop 3D-printed, waterless concrete.
The project is in support of the overall goal of NASA’s return to the Moon: to explore its south pole and begin the process of establishing a long-term presence there.
“Molten sulfur is the binder and regolith, i.e. Lunar soil, acts as the filler material,” said LSU Bert S. Turner Construction Management Assistant Professor Ali Kazemian. “Robotic construction on the Moon using Lunar resources and large-scale 3D-printing technology is the goal. Even shipping raw materials from Earth is cost prohibitive, so the only practical approach is to use the resources which are already available on the Moon and Mars for construction. That is why 3D printing using sulfur-regolith concrete (SRC) is attractive. On the other hand, production of Portland cement concrete, the most commonly used construction material on Earth, will be complicated on the Moon and will require large amounts of water that could otherwise be used for life support or other exploration activities.”
Funded through a $200,198 grant from the National Science Foundation, the work will be carried out at LSU and the NASA Marshall Space Flight Center. The team will study the extrusion parameters and interplay between material-process-environment factors during high-temperature SRC extrusion and test the space resilience of 3D-printed SRC specimens under vacuum conditions and temperature swings, extreme thermal load resistance, and simulated micrometeorite impact resistance.
“The planned research tasks will provide a fundamental understanding of the impacts of high-temperature, extrusion process parameters and environmental factors, such as near-vacuum conditions, on the performance of 3D-printed SRC structures,” Kazemian said. “After reaching these objectives, together with our NASA Colleagues, we will work on design and development of a large-scale SRC 3D-printing system at NASA Marshall to validate our research findings on a large scale. For example, by 3D printing a Lunar habitat analog…”
Whether created with extraterrestrial material, or Earth-bound products, waterless concrete represents a significant step forward in the pursuit of sustainable construction. By eliminating the need for water in the concrete mixing process, this innovative material not only conserves a precious natural resource but also offers a more environmentally friendly alternative to traditional concrete.
What is Waterless Concrete?
Waterless concrete, also known as dry concrete, is a type of concrete that does not require water for mixing or curing. Traditional concrete production involves mixing cement, water, and aggregates like sand and gravel. The chemical reaction between water and cement allows concrete to set and harden. However, waterless concrete uses a different chemical process that eliminates the need for water, relying on chemical additives and reactions to achieve the necessary binding and hardening properties.
Composition and Production
The key to waterless concrete lies in its innovative composition. Manufacturers replace water with chemical activators that trigger the hydration process of cement. These activators are often composed of various compounds that can efficiently initiate and sustain the hydration process without external water. Additionally, waterless concrete incorporates superabsorbent polymers that help in retaining any intrinsic moisture within the mix, which is crucial for the curing process.
The production of waterless concrete involves mixing cement, aggregates, and specific chemical activators under controlled conditions. This process not only reduces the dependence on water but also results in a faster setting time, making it highly beneficial for rapid construction scenarios.
Environmental Benefits
One of the most significant advantages of waterless concrete is its environmental impact. The traditional concrete production process is water-intensive, consuming large quantities of water. By eliminating the need for water in concrete, we significantly reduce water use in construction, conserving this vital resource for other needs, especially in arid regions or places with water scarcity.
Furthermore, waterless concrete contributes to reducing the carbon footprint of construction activities. The production of cement, a primary component of traditional concrete, is energy-intensive and generates considerable amounts of CO2. Since waterless concrete can be formulated to use alternative and less carbon-intensive binders, it offers a greener alternative to conventional concrete.
Applications and Limitations
Waterless concrete is particularly useful in environments where water is scarce or where rapid construction is necessary. It has potential applications in desert regions, in military construction, in space exploration habitats, and in emergency constructions such as flood barriers or temporary shelters in disaster-struck areas.
However, the adoption of waterless concrete also faces certain limitations. The cost of chemical activators can be higher than the traditional water-based mix, making it more expensive in current market conditions. Moreover, because it's a relatively new technology, there may be challenges related to long-term durability and behavior under different environmental conditions, which are still under research and testing.
The Future of Waterless Concrete
As the technology develops and more research is conducted, the applications and efficiency of waterless concrete are expected to expand. Innovations in chemical additives and further understanding of the material's properties could lead to wider acceptance and usage in the construction industry. Additionally, as environmental regulations become stricter and water scarcity issues increase, the demand for sustainable construction materials like waterless concrete is likely to grow.
Efforts to make waterless concrete more cost-effective are also crucial for its adoption. This could involve finding cheaper sources of chemical activators or improving the manufacturing process to reduce costs. Furthermore, education and training for engineers and construction workers in the use of waterless concrete will play a vital role in its integration into mainstream construction practices.

GPRS Concrete Scanning Solutions Ensure Safe Cutting & Coring
As the construction industry continues to evolve towards greener practices, waterless concrete is poised to play a crucial role in shaping the future of construction, making it an exciting area for ongoing research and application.
Of course, no matter the composition of the concrete, it’s important to know what’s embedded within a slab before you cut or core.
GPRS offers comprehensive, precision concrete scanning and imaging services designed to keep you and your team safe, your budget intact, and your projects on time.
Concrete coring comes at a risk to you and your team – as well as your budget and schedule. GPRS’ SIM-certified Project Managers (PMs) are equipped with multiple technologies to clear areas prior to you core drilling and/or anchoring. Upon completion of the scanning process, you will have a clear layout of the vertical and horizontal position of impediments such as post tension cables, rebar, beams, and conduits. Our scanning and imaging services can be completed on any surface you might be working on, including concrete slabs, walls, columns, and beams.
As with concrete coring, it’s crucial to locate unseen or buried objects prior to saw cutting into slab-on-grade concrete. You don’t want to risk severing post tension cables, rebar, conduits, pipes, grade beams, or any of the other obstructions that could be inches from your saw blade. GPRS concrete scanning and imaging services mitigate these risks by utilizing both ground penetrating radar (GPR) scanning and electromagnetic (EM) locating to visualize what is inside and underneath your concrete slab.
We are so confident in our PMs that we introduced the Green Box Guarantee, which states that when we place a Green Box within a layout prior to anchoring or coring concrete, we guarantee that the area will be free of obstructions.
If the area isn’t free of obstructions when you core or cut, GPRS will pay the material cost of the damage.
What can we help you visualize? Click below to schedule a service or request a quote today!
Frequently Asked Questions
Can GPR determine the difference between rebar and electrical conduit?
Ground penetrating radar can accurately differentiate between rebar and electrical conduit in most cases. We have an extremely high success rate in identifying electrical lines in supported slabs or slabs-on-grade before saw cutting or core drilling.
Additionally, GPRS can use EM locators to determine the location of conduits in the concrete. If we can transmit a signal onto the metal conduit, we can locate it with pinpoint accuracy. We can also find the conduit passively if a live electrical current runs through it.
The combined use of GPR and EM locating allows us to provide one of the most comprehensive and accurate conduit locating services available.
Do all concrete scanning companies offer a green box guarantee?
No, the Green Box Guarantee is an industry-leading, proprietary program GPRS created to help prevent injuries and damages. We want to provide you with the peace of mind that comes with knowing you and your team can safely core and drill into concrete without worrying about subsurface damage. GPRS offers this program as part of our pursuit of 100% subsurface damage prevention. We are the only company that can provide the Green Box Guarantee, because we’re the only company that can lean on our industry-leading 99.8%+ accuracy rate for concrete scanning projects.
Construction Industry Facing Mental Health Crisis
Mental illness is just as dangerous to a construction worker as silica exposure, or slips, trips & fall hazards.
In 2022, the construction industry ranked second highest in the U.S. for worker suicide rates, with 45.3 incidents per 100,000 workers. According to the Centers for Disease Control and Prevention (CDC), construction is one of multiple major industry groups with a suicide rate that is higher than in the total civilian noninstitutionalized working population.
According to the National Institute of Mental Health, the suicide rate among males was 4 times higher (22.8 per 100,000) than among females (5.7 per 100,000) in 2021. Per the Bureau of Labor Statistics, 97% of the U.S. construction workforce is male.

Also, per the Bureau, about two-thirds of those employed in the construction industry were 25-to-54 years old. According to the CDC, there were more suicides in the 25–44-year-old age demographic than any other age group in both 2021 and 2022.
“We have to keep reminding everyone that mental health issues in the industry are really common,” Alberici Constructors Safety Director, Kathi Dobson, recently told Construction Dive. “The proportion of individuals impacted because of factors outside of the job site, incidents on the job site, elements of the job site, etc. compounded by substance abuse is significant.”
Numerous non-profits and other organizations are joining construction companies in pouring resources into addressing the industry’s mental health crisis.
Construction Safety Week (CSW) aims to connect workers and their employers with the resources they need to discuss and address mental health awareness in their organizations. This annual safety initiative returns May 6-10, 2024, and will see sponsor companies such as GPRS sending their safety experts across the country to hold free presentations about a variety of safety-related topics, including mental health awareness.
“Given the high-stress nature of the construction industry, characterized by tight deadlines and long hours, the surge in mental health concerns is undeniable,” said Jason Schaff, GPRS’ Senior Vice President of Marketing & SiteMap® Product Executive. “It’s great to witness CSW and GPRS actively promoting awareness around this critical issue.”
The first thing to remember if you or someone you know needs help with a mental illness issue is that you are not alone. There’s no need to be afraid of reaching out, and you can start by connecting with someone you trust for advice, such as a friend, family member, coworker, or faith leader.

Below you will find a list of resources you can turn to in the event of a mental health emergency:
Crisis Resources
- National Suicide Prevention Lifeline: 1-800-273-8255 (Press 2 for Spanish)
- Crisis Text Line: Text HOME to 741741 (to connect with a Crisis Counselor)
- Veterans Crisis Line (call, chat, or text) 1-800-273-8255, Press 1 or https://www.veteranscrisisline.net/
- Crisis Service Canada: 1833-456-4566
Additional Support Resources
- NAMI Help Line
- Call: 1-800-950-6264
- Text NAMI to 741-741
- NAMI Connection Recovery Support Groups
- NAMI Support Groups (for individuals or family members)
- Substance Abuse & Mental Health Services Administration
There are also some common warning signs you can be on the lookout for, both in yourself and others, that may indicate it’s time to seek assistance. These include:
- Excessive worrying or fear
- Feeling excessively sad or low
- Confused thinking or problems concentrating and learning
- Prolonged feelings of irritability or anger
- Avoiding friends and social activities
- Difficulties understanding or relating to other people
- Changes in sleeping or eating habits
- Extreme mood changes
- Difficulty perceiving reality (delusions or hallucinations)
- Inability to perceive changes in one’s own feelings, behavior, or personality
- Multiple physical ailments without obvious causes (such as headaches, stomach aches, vague and ongoing “aches and pains”)
- Overuse of substances like alcohol or drugs
- Thinking about suicide
In a recent article on Construction Dive, CSW organizers urged leaders in the construction industry to prioritize creating a safe space and a culture of trust and leading by example by prioritizing their own mental health.
“Everyone’s mental health is highly unique to themselves with no singular journey,” author and Flourish Psychotherapy founder & CEO, Laurie Sharp-Page, told the publication. “People cope in different ways. It’s important for organizations to have space for every individual. You can’t force someone to take care of mental health. You can help support them.”
Click here to download CSW’s free mental health wellness field guide.
GPRS safety team members are currently scheduling free CSW safety talks. Click below to schedule your team’s talk, today!
Utility GIS Mapping: Revolutionizing Accuracy Before Digging with SiteMap®
With over 20 million miles of underground utility lines scattered on both public and private property, and a utility strike occurring every 62 seconds in the U.S., the need for accurately mapped and securely stored utility Geographic Information System (GIS) mapping data on every job site, everywhere, is paramount for the mitigation of future underground utility damages.
The utility GIS mapping industry has a major problem, however, that first needs to be solved before this goal can be accomplished.
The Challenge of Inaccurate Data
Despite the clear benefits of GIS utility mapping, the industries reliance on outdated and inaccurate data to populate these systems has led to many issues. Data within current utility GIS mapping platforms, while intuitive, lacks accuracy and is usually based on municipalities’ outdated and inaccurate paper plans referenced from centerline data, or eyeballed "measurements," or is based on some as-builts, GPR sketches, and hard copy old-school data that isn’t that valuable. Much of this data is compartmentalized, causing data and communication siloes among team members within municipalities, campus facilities, and construction crews. These issues result in major headaches like project downtime and reworks due to underground utility strikes.

What is GIS Utility Mapping?
GIS utility mapping in theory, is the process of accurately locating and digitally mapping the precise location of all underground utility lines within a municipality, construction site, or facility using a Geographic Informational System. Water, gas, electric, communication, irrigation and sewer utility data are generally stored within the system, with the purpose of providing a comprehensive record of all of the underground infrastructure of a facility or property.

The issue with much of this data, however, is that it is based on maps and as-builts that were incorrect when they were initially uploaded into the system. When this data is then relied upon to either mark utilities on the ground or make digging and design decisions so that excavation, drilling or boring can take place, utility damages result.
To address the ongoing issue of bad as-built data resulting in bad utility GIS mapping data, GPRS created SiteMap® (patent pending). SiteMap® is the first-ever GIS Utility Mapping platform that is composed of 99.8%+ accurate data collected in the field by SIM-certified GPRS Project Managers. Every bit of the utility data displayed within SiteMap®, including but not limited to: water, gas, electric, communication, irrigation and sewer lines, is collected by the nationwide network of boots on the ground GPRS Project Managers. This constant variable is the x-factor between SiteMap® and other utility GIS mapping platforms such as ArcGIS FieldMaps.
SiteMap®: An ArcGIS Alternative
ArcGIS, while likely the most well-known and widely used GIS platform, has many amazing benefits to it, it falls short in providing the up-to-date and accurate underground utility data needed for most contractors, municipalities, engineers, and facility managers to make safe digging decisions. This is because most of ArcGIS's utility information, generally supplied by local municipalities across the U.S., is often based on decades-old centerline data and outdated paper plans.
This is not the fault of ArcGIS, as they are uploading the data which they are given, but if the data uploaded into the system is bad, then the data that is displayed and depended upon by the end user isn't going to be accurate. The difference provided by SiteMap® is that the data within the system is collected in real time as GPRS Project Managers perform utility mapping services in the field throughout the country and upload that data to SiteMap®.
GPRS Market Segment Leader Nate Stair shares how GPRS customers who have used other GIS-based platforms and as-built documentation have experienced accuracy issues in their data.“I frequently hear that other platforms are great, except for the accuracy of the data. I have heard of lines being over 30 feet off. Yes, 30 feet!!! Yes, the line was collected, but the accuracy is almost useless. These [GIS] platforms aren't acting as a living, breathing database like SiteMap®, being tied to GPRS scanning services provided for them.”
The SiteMap® Difference: Accurate Data

What sets SiteMap® apart from other utility GIS mapping platforms like ArcGIS is the meticulous process of data collection and mapping carried out by GPRS's Project Managers through SIM or Subsurface Investigation Methodology that results in accurate data within the system.

SIM is the secret to GPRS’ 99.8% accuracy rating in utility mapping. And that 99.8% accurate data is directly uploaded into our GIS Utility Mapping application, SiteMap®.
SIM mandates the proper equipment, training, and processes for locating contractors to achieve the most accurate results. In the last five years, it has an over 99.8% success rate on over 500,000 projects across the U.S. for GPRS Project Managers, helping to ensure the data within SiteMap® is world class.
SIM is broken into three main categories. Training, Methodology, and Equipment. SIM training includes one-on-one mentorship, in-person classroom instruction by industry experts, and on-the-job field training for two to three months. The methodology that makes SIM-certified Project Managers so effective and the data they collect and upload into SiteMap® so accurate is a systematic, methodical yet flexible approach to utility locating that Project Managers perform on each and every project. This solid, repeatable methodology ensures that each Project Manager can perform the same service and achieve the same results on any project, nationwide.
The final piece of what makes data within SiteMap® much more accurate than that offered elsewhere is the equipment used to collect the data. SIM requires the use of multiple forms of technology on each investigation with the most effective and commonly used being electromagnetic (EM) locators and ground penetrating radar (GPR). The SIM methodology, when rigorously followed, allows Project Managers from GPRS to be the most accurate utility locators in the country. Meaning that the utility locating data within SiteMap® is 99.8% accurate, every time. Regardless of the Project Manager’s tenure, the application of SIM protocols and training allows each locator to achieve industry-best results, so projects can be strike-free for general contractors, municipalities, engineers and facility managers, while remaining on time, on budget, and most importantly, safe.
Build Better With SiteMap®

With millions. of miles of underground utility lines scattered throughout the country and utility strikes occurring close to every minute, the need for an up to data utility GIS mapping platform that ensures accuracy, enhances collaboration, and eliminates data and communication siloes between key stakeholders is more important than ever.
GPRS’s Utility GIS Platform SiteMap® meets this need to eliminate utility strikes for general contractors, municipalities, engineers, and facility managers, as it supplies users with an accurate GIS utility mapping platform that includes the tools and systems in place to view, layer, deconstruct & securely share the data Project Managers collect in the field and upload into the system.
In GIS utility mapping controlling data = controlling damage, and controlling damages controls costs. When the data is accurately located, marked, mapped, and stored in GIS utility mapping software the first time it’s collected, damages on the job can be reduced and workers can go home safe to their families.
To learn how SiteMap® can do just that and more to enhance your subsurface damage prevention, existing condition documentation, and facility and project management needs, schedule a free personal demonstration with one of our experts, today!
Frequently Asked Questions:
How is SiteMap® different from other GIS Platforms?
The data provided within SiteMap® is backed by GPRS’ SIM- certified Project Managers 99.8%+ accuracy on over 500,000 projects across the country within the past five years. Other platforms may provide data that is over 30 feet off from where it is actually located, which is why having a SIM-certified GPRS Project Manager actually collect that data in the field and upload it within SiteMap® makes all the difference in the accuracy of the data displayed within the platform in comparison to other GIS platforms.
Can lines be updated in the system as new infrastructure is added and projects occur on my job site?
Yes. As SiteMap® data is supplied by GPRS Project Managers, the GIS Utility Mapping Platform will upload new data while allowing you and your team to have up to date file of where lines have been re-located or newly installed after our utility mapping service in the field has been completed and uploaded to SiteMap®.
What is the Difference Between Level of Detail and Level of Development?
There is often confusion in the construction and engineering industry regarding level of detail and level of development. The acronym LOD can be used to describe both level of detail and level of development. AEC professionals tend to use these terms interchangeably; however, there are important differences.
Level of detail and level of development are both used in the AEC industry to describe the amount of information and detail included in a 3D building information model (BIM). The main difference is that level of detail refers to the graphical representation of an object, while level of development refers both to the graphical representation and to the information properties of that object.
There is a defined set of LOD specifications for both level of detail and level of development that help AEC professionals document, articulate, and specify BIM models effectively. By using these LOD specifications to scope projects, architects, engineers, and other construction professionals can clearly communicate the precision requirements of the BIM model for faster project execution.

Level of Detail vs. Level of Development
While the two terms are related, they have different meanings when it comes to the 3D modeling of laser scan data. Level of detail is more focused on the visual detail, while level of development is more focused on the completeness and accuracy of the information included in the model.
What is Level of Detail for BIM?
The level of detail refers to the amount of graphical and non-graphical information associated with each element of the building information model. This can be thought of as the graphical depiction and associated text properties of each element in the model. LOD defines the amount of detail and accuracy of the elements within the model. It's typically categorized into five different levels, with higher levels indicating more detail and accuracy.

BIM Level of Detail (LOD) – LOD 100, 200, 300, 400, 500
LOD 100
LOD 100 modeling represents the envelope of objects with simple volumes. Models are designed in a symbolic and generic way. Elements are not fully detailed and may come from other models of the same type. An LOD 100 model can be useful for a simple pre-design study, to conceptualize an idea, or to conduct a basic feasibility study that only requires a rough representation of the volumes of the building or site.
LOD 200
Models are graphically created in a simplified way and are recognizable as an object. The objects remain generic – the position, orientation, shape, and size of the geometric objects are approximate. Specifications such as material characteristics are not integrated in an LOD 200 model.
LOD 300
Models offers more precise geometry of objects and includes accurate quantities, shapes, positions, and orientations.
LOD 400
Models are realistically plotted, with quantities, shapes, positions, and orientations being accurate. Walls, slabs, and ceilings are modeled in such a way that the various layers that compose them are detailed. The purpose of this level of detail is to provide detailed and accurate geometric references. LOD 400 models become a reference point for design and construction planning.
LOD 500
The level of detail LOD 500 is equal to that of the LOD 400, but with all modeled elements verified in the field. This delivers an as-built model of the building, site or asset.
What is Level of Development for BIM?
Level of development refers to the depth of thinking applied to the modeled element within the building information model. Another way to say this is that Level of Development is the completeness of information included in the 3D model, such as the detail about the structural elements, MEP systems, or materials. Each defined “level” outlines requirements to specified visual detail and attached information for an individual modeled element. It also refers to how reliable the depiction and associated properties of the modeled object are.
Level of development specifications guide AEC professionals to develop reliable and understandable building information models (BIM). There are typically five levels of development that are used: the LOD 100, 200, 300, 400, and 500 definitions are produced by the AIA (American Institute of Architects), and the LOD 350 was developed by the BIMForum working group.

BIM Level of Development (LOD) – LOD 100, 200, 300, 350, 400, 500
LOD 100 – CONCEPTUAL
The model element is graphically represented by generic shapes or symbols with approximate geometry, size, shape, location, and orientation. This level is to gain an understanding of the design and the spatial environment.
LOD 200 – APPROXIMATE GEOMETRY
In this level, model elements are graphically represented within the model as a generic system, object, or assembly with approximate specifications, quantities, size, shape, location, and orientation. Any information derived from LOD 200 elements must be considered approximate. LOD 200 models are often used for schematic design purposes.
LOD 300 – PRECISE GEOMETRY
The model includes accurate geometry with specific quantities, sizes, shapes, locations, and orientations of the elements with detailing, fabrication, assembly, and installation information. It's often used for generating construction documents, for design planning and for coordination among disciplines.
LOD 350 – PRECISE GEOMETRY WITH CONNECTIONS
The model element is graphically represented within the model as a specific system, object, or assembly in terms of quantity, size, shape, location, orientation, and interfaces with other building systems. LOD 350 is intended to define requirements for model elements that are sufficiently developed to support construction-level coordination. If a CAD design team has craft knowledge available, they can develop elements to LOD 350 or higher.
LOD 400 – FABRICATION-READY GEOMETRY
At this level, the model element is graphically represented as a specific system, object, or assembly in terms of size, shape, location, quantity, and orientation, detailing, fabrication, assembly, and installation information. At this level, the elements already have the information of a LOD 300, plus the parameters and precise geometry of a specific product, its model, manufacturer, cost, etc. This would be a fabrication level model.
LOD 500 – AS-BUILT MODEL
This is the highest level of detail, and the level is known as an as-built. The modeled element is a field verified representation in terms of size, shape, location, quantity, and orientation. This model is a close replica of the existing building. This LOD generally contains 100% of the necessary information for decision making. LOD 500 models are typically used for facility management and maintenance purposes.
How Does LOD Relate to 3D Laser Scanning?
Efficient communication and collaboration are important during a design or construction project. LOD specifications were designed to standardize models and eliminate questions in the level of detail or level of development included in a building information model. It is important to understand that LOD’s were not originally designed with laser scanning in mind, and therefore not all of the language pertains or relates directly with the technology.
3D laser scanning captures accurate data of a structure or site in the form of a point cloud. This point cloud data is used to generate BIM models through extraction software, tracing methods, and interpretation. This can be done at many different levels of detail and levels of development. It is important to specify the LOD when developing the project proposal. If you are unsure what to spec, one of our GPRS team members can walk you through the detail included in each LOD specification.
CAD designers will model building elements to the LOD specification that is defined in the project proposal. The higher the LOD, the more detail required for the modeled element of interest. LOD specifications can vary throughout the model, often based on element categories, or other grouping methodology. This helps optimize modeling efforts to those elements important to the specific project. LOD specifications also inform the project engineers and designers how much they can rely on details in the building information model. This information allows them to communicate with other team members about the usability and limitations of the model.
For more information on BIM modeling, level of detail, level of development, or as-built models contact GPRS 3D Laser Scanning today at 419-843-7226 or Laser@gprsinc.com. We are happy to answer any questions you have or talk you through the differences between level of detail and level of development.
What can we help you visualize?
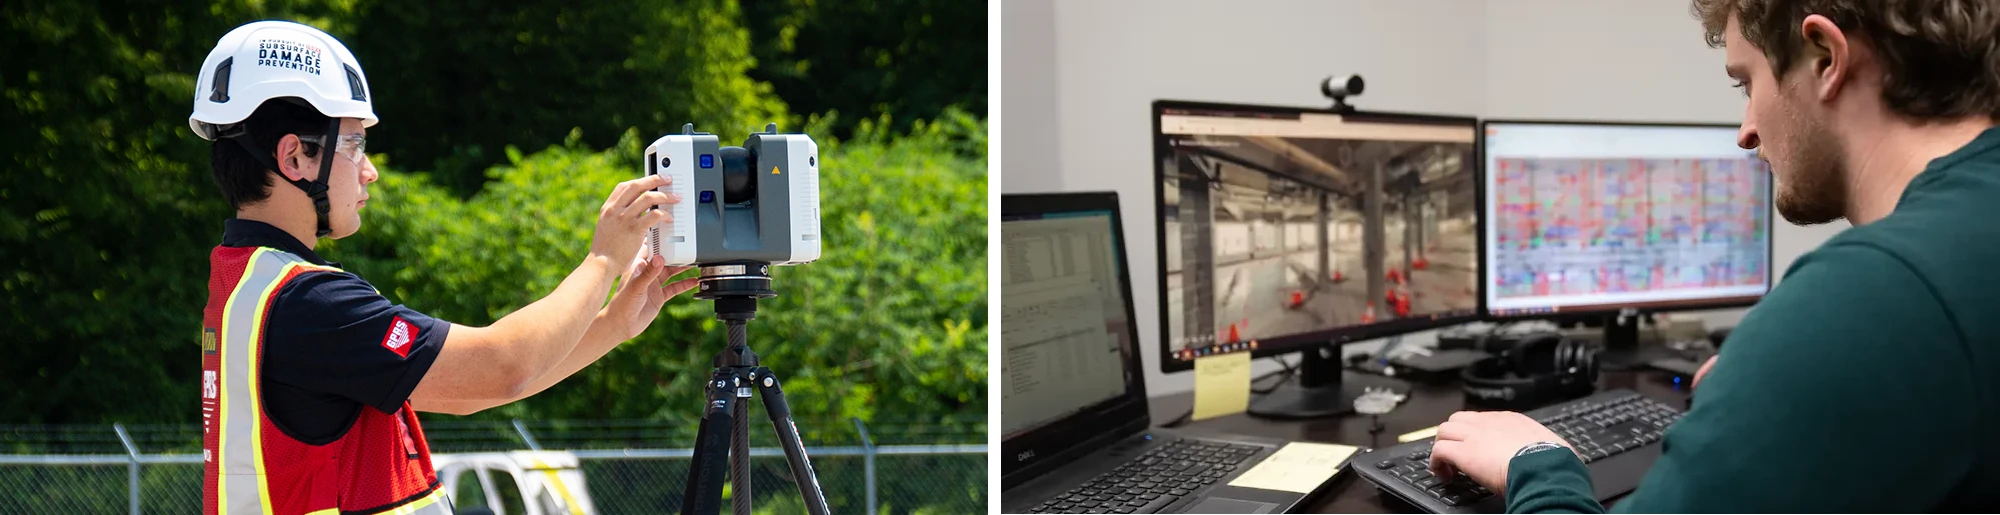
Frequently Asked Questions
What is BIM?
Building information modeling (BIM) is an intelligent software modeling process that engineers, contractors, and architects can use to collaborate on a building’s design, construction, and operation. BIM encompasses not only geometry and spatial relationships, but it also documents building features, such as specific information about the type of materials used, the quantity used, and how those characteristics impact the building as a whole. BIM can be thought of as a database of information ranging from project materials and cost to the 3D model after construction. This information can be used to actively manage a project every step of the way.
What is level of development in construction?
LOD in building information modeling (BIM) stands for level of development, representing the degree of detail and accuracy in the modeling of building elements. It ranges from LOD 100 (conceptual) to LOD 500 (as-built). At LOD 100, basic representations are conceptual, progressing to LOD 500 where elements are precisely as-built. This level of development classification is crucial for communicating with the project team and ensuring the correct level of accuracy for construction documentation.
What is 3D laser scanning?
3D laser scanners use LiDAR (light detection and ranging) technology to map millions of data points of a project site. The primary way a laser scanner works is to send light pulses at high speeds which reflect off objects and return back to the scanner’s sensor. For each pulse, the distance between the scanner and object is measured by determining the elapsed time between the sent and received pulses. Each data point is converted to a pixel with a known x, y, and z coordinate.
Millions of data points from multiple positions and viewpoints are captured and processed into a point cloud, creating an accurate 3D as-built data set of the site. This all happens very quickly, with some scanners, like the Leica RTC360, capturing and calculating 2 million data points per second with 2-4 mm accuracy. The result is a complete and accurate set of real-time data which can be mined for information or processed into customized 2D CAD drawings and 3D BIM models at any level of detail.
Understanding the Data Center Construction Boom
As the digital landscape intensifies in our increasingly connected world, the demand for data centers is set to rise correspondingly. However, the sustainability of these facilities, their energy consumption, and the materials required for their construction must be considered to sustain current construction trends into the future.
A data center serves as a hub that contains the computational and storage capacities essential for the delivery of shared applications and data. Smaller organizations might accommodate these facilities within a dedicated room of an existing building, while larger organizations typically operate several centers exclusively for their extensive data storage and sharing requirements.
The surge in data center construction in the U.S. is largely attributed to the COVID-19 pandemic. As the pandemic kept most Americans home, driving up online shopping, companies from Amazon to Walmart had to significantly expand their data processing capabilities.

Continuing post-pandemic, this growth remains robust. Coldwell Banker Richard Ellis (CBRE), the largest commercial real estate services and investment firm in the world, recently released their latest North American Data Center Trends Report which reveals that 2023 saw an unprecedented 2,287.6 megawatts (MW) of data center construction across key global markets. Megawatts serve as the unit of measurement for the power capacity of a data center.
“Data center construction is at an all-time high, driven by strong demand from all users, including AI, hyperscale and enterprise,” CBRE’s Executive Managing Director for Data Centers Solutions, Pat Lynch, told the Building Design + Construction Network. “New and existing uses of artificial intelligence cases grew tremendously in the first half of the year, and we expect demand to remain strong with AI driving leasing opportunities in the second half of the year.”
There are more data centers in the U.S. than in any other country on Earth – and it’s not even close.
As of March 2024, there were 5,381 data centers operating in the U.S., according to data from Statista.com. Germany has the second-most data centers of any country in the world – with just 521. China and India, the first and second most populous countries in the world, respectively, have just 612 data centers combined.
More Power Needed
Fueling America's expanding fleet of data centers requires substantial power, putting increasing pressure on our aging electrical grid.
The American Society of Civil Engineers' latest Infrastructure Report Card graded America’s energy infrastructure at a C-, highlighting significant concerns about its reliability.
“The exponential growth of data centers with a tremendous appetite for electricity rapidly is outpacing the capacity of utilities to meet their needs,” writes Jack Rogers on Globest.com. “Pushing data center developers to prioritize new markets where they can be sure they can hook up to the grid.”
This is not just an American issue.
The International Energy Agency recently released its 2024 Electricity Report, which analyzes and forecasts the world’s electricity needs through 2026. The report highlights the data center sector’s impact on electricity consumption, positing that its global electricity demand could double towards 2026.
“We estimate that data centres, cryptocurrencies, and artificial intelligence (AI) consumed about 460 TWh of electricity worldwide in 2022, almost 2% of total global electricity demand,” the IEA wrote. “Data centres are a critical part of the infrastructure that supports digitalisation along with the electricity infrastructure that powers them. The ever-growing quantity of digital data requires an expansion and evolution of data centres to process and store it.”
The report goes on to explain that there are two main processes accounting for data centers’ electricity demands; computing and cooling each account for about 40% of the demand, while the remaining 20% comes from other associated IT equipment.
“Future trends of the data centre sector are complex to navigate, as technological advancements and digital services evolve rapidly,” the IEA continued. “Depending on the pace of deployment, range of efficiency improvements as well as artificial intelligence and cryptocurrency trends, we expect global electricity consumption of data centres, cryptocurrencies and artificial intelligence to range between 620-1,050 TWh in 2026, with our base case for demand at just over 800 TWh – up from 460 TWh in 2022...”
The data center industry is exploring solutions to its power needs, including investing in renewable energy. Data from S&P Global shows that U.S. wind and solar capacity contracted to data center providers and customers jumped 50% year over year as of early 2023, to more than 40 gigawatts.
Another potential solution to data centers’ power needs is being explored in West Texas, where Lancium, an energy and data center management firm, is building data centers close to power generating sites in a bet that this will allow them to tap into underused clean power. If their plan works, it could shift where in the U.S. developers prioritize building new data centers.
“It’s a land grab,” Lancium President Ali Fenn told The New York Times in a February 2024 article.
In lieu of building from scratch, data center developers are increasingly turning to adaptive reuse to build the facilities their clients need quicker, with fewer materials, and with a smaller initial carbon footprint.
The challenge with adapting an existing structure to serve as a data center is that unlike building from the ground-up, there’s no one-size-fits-all strategy that a developer can implement.
Rehabbing an abandoned mall is a very different task than retrofitting a disused warehouse. Some adaptive reuse projects may be able to take advantage of the existing infrastructure of the building, while others may need to start over with new power distribution, cooling, and related systems. There may be historic preservation requirements, re-zoning issues, or other hurdles that need to be overcome.
“[Adapting an existing structure into a data center] will require more collaboration between owners, engineers, architects, and contractors to ensure that all requirements can be satisfied within the existing structure,” wrote David Hart of MOCA Systems, Inc. in a piece for Data Center Knowledge. “Identifying and communicating anticipated obstacles early fosters the stakeholder alignment needed to prevent budget overruns, schedule slips, and unfulfilled owner expectations.”

A Bright Future
The importance of data centers to an organization’s operations cannot be overstated.
GPRS Market Segment Leader Kasey Kearcher recalled a conversation with a facility manager at a data center for a major bank in the Mountain Region. The bank has over 100 branches across multiple states and requires two data centers to service those facilities.
GPRS performed comprehensive utility locating and mapping services for one of the bank’s data centers. During this process, Kearcher inquired what would happen should the data center suffer a power outage.
“If they have a shut down, if that data center shuts down for any reason, it costs the bank half-a-million-dollars per minute,” Kearcher explained. “All the banking locations are reliant on this facility, so if there’s ever a utility line strike, or if they have a water line leak and that spills onto any of the equipment, that could be expensive and catastrophic.”
Despite questions about power usage and other challenges, the data center construction boom is only expected to continue.
Google has invested billions in data center expansion over the past few years, including its recent announcement that it will build a $1 billion data center campus in Kansas City, Missouri. Amazon paid $152 million to acquire 140 acres in Prince William County’s Data Center Opportunity Zone Overlay District and are exploring the possibility of construction data center locations there. And Microsoft is already building a data center campus in the area with plans for it to be up and running by mid-2024.
“The demand for data centers is expected to surge in the coming years as the world becomes increasingly interconnected,” The Birmingham Group’s President and CEO, Brian Binke, wrote in a blog post last fall. “With companies like Google, Amazon and Facebook leading the charge, data center construction will continue to thrive, supporting the digital infrastructure needed for a connected future.”
Let GPRS Keep Your Data Center Project On Time, On Budget, and Safe
GPRS delivers a comprehensive array of services for subsurface damage prevention, existing condition documentation, and management of construction and facility projects, ensuring that initiatives like data center builds remain on schedule, within budget, and safe.
Our offerings in concrete scanning, utility locating, video pipe inspection, and leak detection help prevent subsurface damage during excavation, or when drilling or slicing through concrete. Leveraging cutting-edge tools like ground penetrating radar (GPR), electromagnetic (EM) locating, and remote-operated sewer pipe inspection rovers, our SIM and NASSCO-certified Project Managers (PMs) equip you with an in-depth view of your site’s subsurface structures.
For a clear depiction of above-ground conditions and to document our PMs’ findings in utility locating and concrete scanning, our 3D laser scanning and photogrammetry services deliver 2-4 mm-accurate data useful for both project design and future operation and maintenance (O&M) tasks. Furthermore, our internal Mapping & Modeling Department can tailor this data into any required format and software.
With SiteMap® (patent pending), GPRS’s cloud-based application for project and facility management, you have around-the-clock access to all this field-verified data, enhancing the protection of your assets and personnel.
SiteMap® enables seamless collaboration, allowing you and your team to securely access and share crucial data anytime and from anywhere, using any computer, tablet, or mobile device.
GPRS’ SiteMap® team members are currently scheduling live SiteMap® demos. Click below to schedule yours and see how SiteMap® can help you plan, design, manage, dig, and build better today!
Frequently Asked Questions
What are the Benefits of Underground Utility Mapping?
Having an updated and accurate map of your subsurface infrastructure reduces accidents, budget overruns, change orders, and project downtime caused by dangerous and costly subsurface damage.
How does SiteMap® assist with Utility Mapping?
SiteMap®, powered by GPRS, is the industry-leading infrastructure management program. It is a single source of truth, housing the 99.8%+ accurate utility locating, concrete scanning, video pipe inspection, leak detection, and 3D laser scanning data our Project Managers collect on your job site. And the best part is you get a complimentary SiteMap® Personal Subscription when GPRS performs a utility locate for you.
Click here to learn more.
Does SiteMap® Work with my Existing GIS Platform?
SiteMap® allows for exporting of data to SHP, GeoJSON, GeoPackage, and DXF directly from any user’s account that either owns or has a job shared to their account. All these file formats can be imported and utilized by other GIS packages if manually imported by the user. More information can be found at SiteMap.com.
How Artificial Intelligence Can Aid the Construction Industry
Artificial Intelligence (AI) has seamlessly woven itself into the fabric of our daily life for years. And contrary to the apocalyptic scenarios of AI portrayed in popular fiction, current AI technologies such as Apple’s Siri and OpenAI’s ChatGPT are based on established machine learning models requiring continuous input from data scientists – meaning we’re still at least a few years away from robots taking over the world.
In the realm of construction, AI plays a pivotal role in enhancing project management, Operations & Maintenance (O&M), and safety protocols.
Boston, Massachusetts-based construction company Suffolk was recently featured in a Business Insider series exploring how AI is being used across different industries. In 2017, Suffolk appointed its first chief data officer, Jit Kee Chin, and invested in construction startups and used its own jobsites to test out potential solutions to safety-related problems.
Suffolk worked with NewMetrix, a startup based in Cambridge, Massachusetts, to develop a safety-solution-leveraging AI to digitize the process of safety observations and incident data gathering.
“The shift from manual and analogue to digital enabled us to collect data, and that’s the most important piece of all of this,” Suffolk’s National Director of Operational Excellence, Kelsey Gauger, told Business Insider. “It plays into our data strategy.”
NewMetrix then developed a predictive model that leverages AI to assign risk ratings to Suffolk job sites and predict the likelihood of an incident occurring on them. The model’s findings led Suffolk to change their key performance indicator (KPI) for jobsite safety: from a target of reducing the total number of on-site incidents to the number of safety observations carried out per workforce hours accumulated.
Suffolk saw a 25% improvement rate in their total recordable incident rates in the fiscal year following the implementation of this data-driven strategy. NewMetrix’s machine-learning model now accounts for 40 different factors correlated with safety outcomes on Suffolk job sites.
“One of the things that we’ve been able to do is actually flag at-risk projects, in addition to driving safety observations, so we can actually plug into that model all of this information and it can tell us ‘Here are the three jobs in your portfolio that are the most at risk,’” Gauger said.
Job Security
AI isn’t going to take over the world tomorrow, but many employees are concerned that it’s going to take their jobs away.
ResumeBuilder recently surveyed 750 business leaders at companies that currently use or plan to use AI in 2024:
- 53% of the companies surveyed use AI, and 24% plan to start in 2024
- 37% of the companies using AI say the technology replaced workers in 2023
- 44% of companies surveyed say AI will lead to layoffs in 2024
- 96% of companies hiring in 2024 say candidates will benefit from having AI skills
- 83% say AI skill will help current employees retain their jobs
AI can’t steal jobs that were already open.
There were 413,000 open construction jobs on the last day of January 2024. That’s more unfilled positions than the same time in 2023, and near the record 454,000 vacancies that existed the previous November, according to data from the Bureau of Labor Statistics.
Henning Roedel, robotics lead for the innovation team at Redwood City, California-based DPR Construction, told Construction Dive in an article published last May that, “We don’t think about how to reduce our staff size, because we have enough backlog and work ahead of us that we need more people.”
“You need to flip the displacement question around because we currently don’t have enough people in our industry to meet the construction needs of society as it is,” Roedel continued.
While it’s not likely to replace a workforce anytime soon, AI does face other challenges as its champions look to integrate it into the construction industry. Many of these concerns aren’t industry-specific; questions about data privacy and technology cost arise no matter which sector is looking to introduce AI-driven solutions to its problems.
“Despite these challenges, the potential of AI in construction is immense,” American Management Services, Inc.’s Louis Mosca wrote last year in an article in Forbes Magazine. “As technology continues to evolve, we can only imagine how much more it could reshape the industry.”
Producers of AI-driven tools for the construction industry believe they are doing what has always been done: innovate to increase productivity, efficiency, and accuracy.
GPRS Combines AI with Field-Verified Data
GPRS utilizes artificial intelligence in conjunction with field-verified data to create accurate digital maps and models for use in AEC industries. While we believe in embracing innovative technologies, we complement those tools with our highly trained field staff and in-house Mapping and Modeling Department.
“At GPRS, the Mapping and Modeling Department creates accurate 3D tours, as-builts, intelligent 3D building information modeling (BIM) models, and geolocated utility maps that can be used in (conjunction with) AI to help project planning, design coordination, and project execution,” explained GPRS Mapping and Modeling Manager, Michelle Colella. “GPRS’ Mapping and Modeling Department uses AI natively in most of our work to automatically extract features and lines in a utility map, to analyze concrete reinforcement as-built, to quickly extract 3D modeled elements in a point cloud from laser scanning, and even to classify point clouds into their different functional elements like walls and floors.”
“All of the digital drawings and models we build can be used in AI-driven construction activities like clash detection, digital twins, or functional analysis of a structure, site plan, or mechanical system,” Colella concluded.
From skyscrapers to sewer lines, GPRS Intelligently Visualizes the Built World® to keep your projects on time, on budget, and safe.
What can we help you visualize? Click below to schedule a service or request a quote today.
Frequently Asked Questions
What is BIM?
BIM stands for Building Information Modeling and is more than just a 3D model. 3D BIM scanning gives engineers the ability to manage the building data throughout its lifecycle, providing accurate spatial relationships and manufacturer details as well as geographic information and other pertinent aspects of the building.
What is As-Built Documentation?
As-built 3D documentation is an accurate set of drawings for a project. They reflect all changes made during the construction process and show the exact dimensions, geometry, and location of all elements of the work.
Connecting the Dots: The Role of SiteMap® in Enhancing Infrastructure Maps for Asset Management
Infrastructure management is undergoing rapid transformation and continues to evolve swiftly.
The introduction of digital mapping technologies has significantly enhanced the capability to visualize, analyze, and manage assets effectively. As urbanization accelerates and infrastructure networks broaden, the need for innovative solutions to streamline asset management processes is more pressing than ever.
SiteMap® (patent pending), powered by GPRS, stands at the forefront of GIS infrastructure mapping software. Featuring advanced capabilities and a user-friendly interface, SiteMap® allows users to interact with precise maps of underground utilities, streamline asset management workflows, and improve infrastructure planning and operations.

The Significance of GIS Mapping Software
GIS mapping software is essential in the realm of infrastructure asset management, offering a digital platform for storing, analyzing, and visualizing spatial data. Where asset managers once depended on paper-based maps and manual tracking processes, the advent of GIS mapping software has revolutionized the field. It introduces advanced capabilities like interactive mapping, data integration, and real-time updates. SiteMap® distinguishes itself as a leading solution in this area, enabling users to access precise, current maps of underground utilities and infrastructure assets.
There are four trends that are expected to forge the way in the world of GIS mapping and capabilities:
- Widespread advancements in location-based technologies: Accelerated progress in geospatial technologies, including location-based services, is expected to add impetus to GIS industry dynamics over the upcoming years. Moreover, the mounting use of cloud-based GIS platform is likely to further boost market growth.
- Penetration of GNSS systems in precision applications: With regards to component, the GIS market from the GNSS (Global Navigation Satellite System) antenna segment is projected to depict a commendable 10% CAGR through 2024. This is attributed largely to the novel frequencies and signals emerging in modern GNSS platforms, which will position the products as crucial components in GNSS receiver functioning.
- Innovative initiatives by prominent GIS industry players: The competitive landscape of the GIS industry is characterized by the emergence of numerous innovations in geospatial technology. Initiatives such as partnerships and product development are also likely to intensify competition in the overall business landscape. Platforms like SiteMap® are in line to take the lead, advancing the technology, and simplifying the methods.
- Development of sat-nav technologies in North America: On the regional front, the North America geographic information system (GIS) market is anticipated to hold more than 35% market share by 2024. This growth is ascribed mainly to the rapid growth of geospatial technology, including the introduction of novel satellite navigation systems.

Features of SiteMap® Underground Utility Mapping Software
Interactive Mapping Interface
SiteMap® boasts an intuitive and user-friendly mapping interface that allows users to visualize underground utilities with ease. By overlaying different layers of utility data onto a digital map, users can gain valuable insights into the spatial relationships and characteristics of subsurface infrastructure. This comprehensive view enables better decision making, risk assessment, and project planning.
As-Built Mapping
SiteMap® facilitates the creation of accurate as-built maps, enabling users to compare planned designs with actual construction data. This integration enhances accuracy and facilitates the identification of discrepancies or deviations from the original plans. By providing a clear understanding of the current state of infrastructure assets, SiteMap® empowers users to make informed decisions and prioritize maintenance and repair activities effectively.
Increase Communication
SiteMap® helps boost communication by creating a single source of truth that can be utilized by all key-players. SiteMap® users need no extra knowledge to properly utilize SiteMap® maps or technology. This helps break barriers, keeping all project managers, stakeholders, and field workers informed and safe.
Backed by GPRS
SiteMap® is the only infrastructure mapping software that has the outstanding power of GPRS behind it. Featuring detailed, aggregated, interactive maps and more, the data you interact with in SiteMap® is provided by the elite team of Project Managers employed by GPRS. This team has earned a 99.8% accuracy rating across over 500,000 jobs nationwide. No other software can currently claim this level of verifiable accuracy. GPRS is in pursuit of a world with 100% subsurface damage prevention. Our 99.8% accuracy rate for ground penetrating radar services (GPR), utility locating services, utility mapping services, and concrete scanning services will locate critical targets like underground utilities, post tension cables, rebar, conduits, underground storage tanks (USTs), and more to help keep your project on time, on budget, and safe.
The Impact of SiteMap® on Asset Management
The adoption of SiteMap® underground utility mapping software has had a transformative impact on infrastructure asset management across various sectors. By providing a centralized platform for data visualization, analysis, and collaboration, SiteMap® facilitates informed decision-making, optimized resource allocation, and improved project outcomes. Whether it's urban development, transportation planning, or utility maintenance, SiteMap® empowers users to navigate the complexities of asset management with confidence and precision.
GPRS SiteMap® team members are currently scheduling live, personal SiteMap® demos. Click below to sign up for your demo today!
How Fortifying Against Extreme Weather Builds a Resilient Future for Infrastructure
The federal government is injecting millions of dollars into projects designed to bolster the United States’ transportation systems against the extreme weather impacts of climate change.
The U.S. Department of Transportation (DOT) recently released $830 million for 80 projects across the country designed to make surface transportation systems more resilient to extreme weather, including flooding, sea-level rise, and heat waves, according to an agency press release.
These grants are the first of their kind dedicated to transportation infrastructure resilience and were made possible by the Bipartisan Infrastructure Law’s Promoting Resilient Operations for Transformative, Efficient, and Cost-saving Transportation (PROTECT) Discretionary Grant Program, which according to the release, complements PROTECT Formula funding that is already flowing to states for these types of projects.

“From wildfires shutting down freight rail lines in California to mudslides closing down a highway in Colorado, from a drought causing the halt of barge traffic on the Mississippi River to subways being flooded in New York, extreme weather, made worse by climate change, is damaging America’s transportation infrastructure, cutting people off from getting to where they need to go, and threatening to raise the cost of goods by disrupting supply chains,” said U.S. Transportation Secretary Pete Buttigieg. “Today… we are awarding nearly $830 million to make transportation infrastructure in 39 states and territories more resilient against climate change, so people and supply chains can continue to move safely.”
As part of the announcement, the Federal Highway Administration awarded funding under four different grant types to 80 projects in 37 states, the District of Columbia, and the Virgin Islands:
Planning Grants: 26 projects will receive approximately $45 million to help grant recipients develop resilience-improvement plans, resilience planning, predesign and design activities, capacity-building activities, and evacuation planning and preparation initiatives.
Resilience Improvement Grants: 36 projects will receive approximately $621 million to enhance the resilience of existing surface-transportation infrastructure by improving drainage, relocating roadways, elevating bridges, or incorporating upgrades to allow infrastructure to meet or exceed design standards.
Community Resilience and Evacuation Routes: 10 projects will receive approximately $45 million for improvements to enhance the resilience of evacuation routes or to enhance their capacity and add redundant evacuation routes.
At-risk Coastal Infrastructure: Eight projects will receive approximately $119 million to protect, strengthen, or relocate coastal highway and non-rail infrastructure.
A full list of grant recipients can be found here.
“Every community in America knows the impacts of climate change and extreme weather, including increasingly frequent heavy rain and flooding events across the country and sea-level rise that is inundating infrastructure in coastal states,” said FHWA Administrator Shailen Bhatt. “This investment from the Biden-Harris Administration will ensure our infrastructure is built to withstand more frequent and unpredictable extreme weather, which is vitally important for people and businesses that rely on roads and bridges being open to keep our economy moving.”
The Growing Challenge of Extreme Weather
The changing climate has altered the landscape of risk for infrastructure globally. Rising temperatures, increased precipitation in some areas, and prolonged droughts in others present complex challenges that existing infrastructure was not originally designed to withstand. These changes have resulted in more frequent and severe weather events, from the flooding of major urban centers to the destructive paths of hurricanes across coastlines.
Strategies for Enhancing Infrastructure Resilience
Here are some key strategies that governments and industries are adopting to combat the impacts of extreme weather:
Robust Design and Construction
- Flood-resistant structures: Elevating building foundations, using water-resistant materials, and installing sump pumps and other flood mitigation systems can prevent water damage.
- Wind-resistant features: For hurricane-prone areas, incorporating wind-resistant roofing and impact-resistant windows ensures structures can withstand high winds and flying debris.
- Fire-resistant materials: In fire-prone regions, using non-combustible building materials and creating defensible spaces around structures reduce wildfire risks.
Technology and Innovation
- Smart infrastructure: Leveraging technology like sensors and IoT devices can help monitor the health of infrastructure and provide real-time data to preemptively address potential failures.
- Advanced modeling techniques: Using computer simulations to predict and plan for potential impacts of extreme weather can guide more informed decisions in infrastructure design and emergency response planning.
Policy and Planning
- Updated building codes and standards: Implementing and enforcing updated building codes that account for changing climate conditions can dramatically increase new structures' resilience.
- Strategic urban planning: Encouraging the development away from high-risk areas, such as flood plains and wildfire-prone zones, minimizes potential damage and reduces recovery costs.
Natural and Green Infrastructure
- Wetlands restoration and maintenance: Wetlands act as natural buffers against storms and floods, absorbing excess water that might otherwise flood urban areas.
- Urban green spaces: Parks, gardens, and green roofs can help manage stormwater, reduce heat islands, and improve air quality, contributing to overall urban resilience.

Case Studies of Resilience
Several initiatives across the United States exemplify the successful implementation of resilience strategies:
- New York City's post-Sandy rebuilding: Following Hurricane Sandy, New York City launched comprehensive efforts to rebuild more resiliently. This included constructing seawalls, elevating homes and infrastructure, and enhancing the resilience of the electrical grid.
- Miami's focus on flood prevention: Miami has invested in pump stations, raised roadways, and revised building codes to combat the increasing problem of flooding, especially from rising sea levels and storm surges.
Economic and Social Benefits of Resilient Infrastructure
Investing in resilient infrastructure not only reduces the cost of disaster recovery but also provides substantial economic benefits:
- Reduced recovery and repair costs: Stronger, more resilient structures withstand extreme conditions better, reducing the need for frequent and expensive repairs.
- Economic stability: By maintaining functional infrastructure, businesses can operate uninterrupted, which is crucial for local economies during and after disasters.
- Community well-being: Resilient infrastructure helps ensure that essential services such as hospitals, schools, and emergency services remain operational during crises, providing a sense of security and normalcy for residents.
Challenges and Future Directions
Despite the clear benefits, there are significant challenges to enhancing infrastructure resilience:
- Funding: Even with the recently announced federal funding initiatives, the high initial costs of upgrading and building resilient infrastructure can be a major barrier for many communities. This is especially true in developing regions.
- Policy coherence: Coordinating between various levels of government and different sectors is essential for effective resilience planning but can be difficult to achieve.
- Technological integration: While technology offers promising solutions, integrating new systems into existing infrastructure requires careful planning and significant investment.
As extreme weather events become more common, the importance of resilient infrastructure cannot be overstated. By investing in robust construction, embracing innovation, updating policies, and utilizing natural solutions, communities can safeguard against the worst impacts of climate change.
While challenges remain, the path forward must include a coordinated, comprehensive approach that ensures all communities can thrive in the face of increasing climatic threats. Building resilience today is not just about preventing future disasters; it's about creating a sustainable and secure future for generations to come.
GPRS services help Intelligently Visualize The Built World®, keeping projects such as infrastructure repair, maintenance and renovations on time, on budget, and safe.
What can we help you visualize? Click below to schedule a service or request a quote today!
The Booming U.S. Data Center Construction Market: Trends and Implications
Virginia’s Meadowville Technology Park will soon be home to a 139,000-square-foot data center with a 20-megawatt initial capacity that is expected to eventually double to 40 megawatts.
The project is being developed by Dublin, Ireland-based data center developer Chirisa, with DPR Construction selected as the general contractor, according to an article in Construction Dive.
The new data center will complement Chirisa’s existing 242,000 sq.ft. data center at the park, which is currently being upgraded to 18 megawatts from its current 6-megawatt capacity. The developer is also seeking to build a third data center at the park on the 300,000 sq.ft. site of an unfinished industrial project that was originally supposed to be a packaging factory.

In recent years, the United States has witnessed a significant surge in the construction of data centers, a trend driven by an insatiable demand for data processing and storage capabilities.
This boom is not just a response to the increasing consumption of digital services by consumers and businesses, but also a strategic move by tech giants and investors to future-proof infrastructure in an increasingly digital world.
Understanding the Data Center Construction Boom
Drivers of Growth:
Several key factors contribute to the rapid expansion of data center construction in the U.S.:
Digital Transformation: As more businesses undergo digital transformations, the need for robust IT infrastructure to support cloud computing, big data analytics, and online services has skyrocketed.
Internet of Things (IoT) and AI: The proliferation of IoT devices and the advancement in AI technologies have created vast amounts of data that need processing and storage, further fueling the demand for data centers.
Remote Work and Learning: The shift towards remote work and online education, significantly accelerated by the COVID-19 pandemic, requires substantial data processing capabilities, which data centers provide.
Legal and Regulatory Factors: Data sovereignty laws and privacy regulations, such as GDPR in Europe, are prompting companies to localize data storage and processing, leading to increased construction of data centers across the U.S.
Geographic Hotspots:
While data centers are being built across the country, certain regions have emerged as hotspots, including Northern Virginia, which hosts the largest concentration of data centers globally. Other significant areas include Silicon Valley, Dallas, Chicago, and Phoenix. These regions are favored due to their relatively low energy costs, favorable climate for natural cooling, and robust connectivity infrastructure.
Trends in Data Center Construction
Sustainability Focus:
One of the most noteworthy trends in data center construction is the focus on sustainability. Companies are increasingly adopting green building practices and striving to achieve energy efficiency and reduce carbon footprints. This involves the use of renewable energy sources, advanced cooling mechanisms, and innovative architectural designs that minimize energy consumption.
Modular and Scalable Designs:
The uncertainty and rapid evolution of technology demand flexibility in data center design. Modular data centers, which are prefabricated units that can be easily shipped and assembled, are becoming popular due to their scalability. These allow businesses to scale their data processing capabilities as needed without a significant upfront investment in a permanent facility.
Edge Computing:
To reduce latency and increase the speed of data processing, there is a growing trend towards building smaller, localized data centers closer to users. This concept, known as edge computing, is particularly beneficial for real-time data processing applications, such as those used in autonomous vehicles and real-time analytics.
Economic and Community Impact
Job Creation:
The construction of data centers is a significant job creator, both during the construction phase and for ongoing operations. Each new data center requires a workforce for IT management, maintenance, security, and administration, providing a boost to local economies.
Infrastructure Development:
Data center construction often leads to improvements in local infrastructure, including upgrades to power grids, water supply, and telecommunications networks. This can have broader benefits for communities, improving the overall business environment and quality of life.
Challenges and Considerations
Despite the benefits, the boom in data center construction comes with its set of challenges:
Energy Consumption: Data centers are intensive energy users, and as their number grows, so does their impact on the energy grid and resources. Balancing this demand with the need for sustainability is a continuing challenge.
Community Relations: The construction of large facilities can sometimes meet with opposition from local communities, particularly if it leads to concerns over resource use, environmental impact, or aesthetic changes.
Technological Changes: Rapid technological advances can make a data center obsolete if not designed with future trends in mind, posing risks for developers and investors.

GPRS Services Ensure Safe Construction/Renovation of Data Centers
The construction of data centers in the United States is a dynamic market characterized by rapid growth and significant investment.
Driven by the need to support an ever-growing demand for digital services, this trend is reshaping the landscape of U.S. infrastructure. While it brings substantial economic and technological benefits, it also presents challenges that require innovative solutions and thoughtful planning. As the digital world continues to evolve, so too will the strategies for data center development, ensuring they meet the future's needs efficiently and sustainably.
GPRS offers a suite of subsurface damage prevention, existing condition documentation, and construction & facilities project management services designed to keep projects such as the construction of data centers on time, on budget, and safe.
Our concrete scanning, utility locating, video pipe inspection, and leak detection services mitigate subsurface damage while breaking ground, or coring or cutting concrete. Utilizing state-of-the-art technology such as ground penetrating radar (GPR), electromagnetic (EM) locating, and remote-controlled sewer pipe inspection rovers, our SIM and NASSCO-certified Project Managers (PMs) provide you with a comprehensive understanding of your site’s subsurface infrastructure.
To visualize what’s above ground and capture our PMs’ utility locating and concrete scanning markings, our 3D laser scanning and photogrammetry services provide you with 2-4 mm-accurate data that will aid you in both project planning, and operation and maintenance (O&M) activities down the road. And our in-house Mapping & Modeling Department can visualize this data in whatever deliverable format and software you require.
All this field-verified data is at your fingertips 24/7 thanks to SiteMap® (patent pending), GPRS’ cloud-based project & facility management application that provides accurate existing condition documentation to protect your assets and people.
SiteMap® allows for secure collaboration between you and your team members whenever and wherever you may be located. Securely access and share your data at any time, from any computer, tablet, or mobile device.
GPRS’ SiteMap® team members are currently scheduling live SiteMap® demos. Click below to schedule yours and see how SiteMap® can help you plan, design, manage, dig, and build better today!
The History of Geographic Information Systems (GIS) and Their Role in Visualizing Utility Infrastructure
Geographic Information Systems (GIS) have revolutionized the way we visualize, analyze, and interpret data related to the Earth's surface. From its early inception to the sophisticated systems that we use today, GIS technology has become integral in multiple fields, including utility management. This article explores the historical development of GIS and how it has become an essential tool in visualizing and managing utility infrastructure.

The Origins of GIS
Early Developments:
The concept of GIS originated in the early 1960s with the work of Roger Tomlinson, who is often called the "Father of GIS." Tomlinson developed the Canada Geographic Information System (CGIS) to assist in managing land inventory in Canada, marking the first use of GIS in compiling and analyzing geographic data on a large scale.
Technological Advancements:
The development of GIS was closely tied to advances in computer technologies, particularly in terms of data storage, processing power, and graphical display techniques. By the 1980s, as computers became more accessible and powerful, GIS applications began to spread across various fields beyond land management, including environmental sciences, resource management, and urban planning.
Evolution into Modern GIS
The Shift to Digital:
The digitization of maps and the introduction of digital cartography were significant milestones in the history of GIS. These advancements allowed for more dynamic interaction with geographic data, enabling users to manipulate and analyze layers of information effectively.
Integration with Remote Sensing:
Another leap in GIS technology came with its integration with remote sensing data obtained from satellites and aerial surveys. This integration provided GIS users with up-to-date, high-resolution images of the Earth’s surface, enhancing the accuracy and utility of geographic analyses.
The Advent of Internet GIS:
The rise of the internet in the late 1990s and early 2000s transformed GIS from a largely desktop-based application to a more accessible, web-based tool. Online GIS platforms allowed for real-time data sharing and collaboration among users across different locations, significantly expanding the technology’s reach and application.

GIS in Visualizing Utility Infrastructure
Mapping and Monitoring:
In the realm of utility management, GIS is primarily used for mapping and monitoring infrastructure. Utilities such as electricity, water, gas, and telecommunications rely heavily on GIS for the spatial representation of their assets, including pipelines, transmission lines, plants, and service areas. This spatial visualization helps utility companies, facility managers and contractors in planning maintenance, managing outages, and optimizing service delivery.
Integration with Asset Management:
GIS platforms integrate with other information systems used by utility companies, facility managers and contractors, such as asset management and customer information systems. This integration enables the seamless flow of information, allowing for efficient management of resources, quick response to emergencies, and improved service reliability.
Enhancing Predictive Maintenance:
GIS technology facilitates predictive maintenance strategies in utility management. By analyzing geographic data alongside historical data on asset performance and weather patterns, GIS can help predict potential failures and guide proactive maintenance efforts. This not only helps in reducing downtime but also extends the life of the infrastructure.
Supporting Expansion and Compliance:
As utility networks expand to meet growing demand, GIS is crucial in planning and implementing expansion projects. It helps in identifying optimal routes for new lines and assessing environmental impacts, ensuring compliance with regulatory requirements. GIS also plays a key role in public engagement by providing clear, understandable maps and visualizations to communicate project details.
The evolution of Geographic Information Systems from basic mapping tools to complex analytical frameworks has significantly influenced many sectors, with utility management standing out as one of the primary beneficiaries. Today, GIS is indispensable in visualizing and managing utility infrastructure, offering a crucial technological advantage in maintaining, expanding, and optimizing utility services. As GIS technology continues to evolve with advancements in AI and big data analytics, its role in utility management is set to become even more profound, driving efficiency and innovation in the face of growing global demand and environmental challenges.
SiteMap® (patent pending), powered by GPRS, is a cloud-based application for project and facility management that ensures precise documentation of existing conditions to safeguard your assets and personnel. Beyond its inherent GIS functionalities, SiteMap® supports the export of data in various formats such as SHP, GeoJSON, GeoPackage, and DXF, accessible directly from any user account that owns or has access to a shared job. These formats can be integrated into other GIS systems through manual importation by the user.
With SiteMap®, the field-verified infrastructure data gathered by GPRS' SIM and NASSCO-certified Project Managers is readily available around the clock, securely accessible from desktops, tablets, or via the SiteMap® Mobile App.
SiteMap® heralds a new phase in the evolution of GIS technology, equipping you and your team with the tools to plan, manage, excavate, and build better.
GPRS’ SiteMap® team members are currently scheduling live SiteMap® demonstrations. Click below to schedule your SiteMap® demo today!
The Evolution and Future Pathways of the Geographic Information Systems (GIS) Market
The Geographic Information Systems (GIS) market has experienced significant growth and transformation over the past few decades, driven by advancements in technology and an increasing recognition of the technology’s utility in diverse fields such as urban planning, agriculture, emergency response, and beyond.
As we look towards the future, the GIS market is poised to continue its evolution, incorporating emerging technologies and expanding its influence on strategic decision-making across industries.

Current Trends in the GIS Market
Integration with Cloud Computing:
One of the most significant current trends in the GIS market is the integration of cloud technology. Cloud-based GIS solutions offer several advantages, including scalability, flexibility, and cost-effectiveness. They allow for enhanced data storage, processing, and accessibility, which is particularly beneficial for organizations handling large datasets and requiring real-time data access and analysis.
Proliferation of Mobile GIS:
With the increasing use of smartphones and tablets, mobile GIS has become more prevalent. These applications allow field workers in sectors like utility management, forestry, and disaster response to capture, analyze, and share geographic information in real-time, enhancing operational efficiency and decision-making processes.
Focus on Real-time Data and IoT:
The integration of GIS with the Internet of Things (IoT) is enabling real-time geographic data collection and analysis. Sensors and connected devices stream data continuously, allowing for dynamic mapping and monitoring. This real-time capability is crucial for applications such as traffic management, environmental monitoring, and smart city initiatives.
Advanced Spatial Analytics Tools:
There is an ongoing advancement in spatial analysis tools that leverage machine learning and artificial intelligence (AI). These tools can predict patterns and trends, providing deep insights that were not previously possible. For example, AI can help in predictive maintenance of infrastructure by analyzing GIS data alongside historical maintenance data.
Future Trends in the GIS Market
Augmented and Virtual Reality (AR/VR):
Looking ahead, AR and VR are set to transform how GIS data is visualized and interacted with. By overlaying digital information onto the real world (AR) or creating immersive environments (VR), users can understand spatial information in intuitive and impactful ways. This technology could revolutionize training, simulations, and data presentation in fields like urban planning and education.
Greater Emphasis on Sustainability:
GIS is expected to play a crucial role in sustainability efforts around the world, particularly in managing natural resources and mitigating the impacts of climate change. For instance, GIS can help in optimizing land use, conserving water resources, and planning renewable energy projects.
Increased Automation and Smart Technologies:
Automation, driven by AI and machine learning, will increasingly be used to streamline data collection, processing, and analysis in GIS workflows. This will lead to more sophisticated and autonomous GIS applications that can provide insights without human intervention, enhancing efficiency and reducing the possibility of human error.
Expansion into New Industries:
As the versatility of GIS becomes more widely recognized, it will continue to penetrate new markets and industries. Healthcare, for example, can benefit from GIS for epidemiology and managing healthcare services. Similarly, retail businesses are using GIS for site selection, customer segmentation, and supply chain management.

SiteMap® Supports Current & Future GIS Trends
The GIS market is on a dynamic path, with ongoing innovations and expansions that are reshaping how geographic information is used and valued across the globe. As technology continues to evolve, so too will the capabilities and applications of GIS, making it an indispensable tool in our increasingly data-driven world.
This transformation not only promises enhanced operational efficiencies and decision-making capabilities but also contributes significantly to tackling some of the most pressing environmental and societal challenges of our time.
SiteMap® (patent pending), powered by GPRS, is a cloud-based project & facility management application that provides accurate existing condition documentation to protect your assets and people. In addition to offering its own GIS capabilities, SiteMap® allows for exporting of data to SHP, GeoJSON, GeoPackage, and DXF directly from any user’s account that either owns or has a job shared to their account. All these file formats can be imported and utilized by other GIS packages if manually imported by the user.
With SiteMap®, the field-verified infrastructure data collected by GPRS’ SIM and NASSCO-certified Project Managers is at your fingertips 24/7, securely accessible via desktop, tablet, or the SiteMap® Mobile App.
SiteMap® represents the next step in the evolution of GIS technology, allowing you and your team to plan, manage, dig, and ultimately build better.
GPRS’ SiteMap® team members are currently scheduling live SiteMap® demonstrations. Click below to schedule your SiteMap® demo today!
Innovations in Infrastructure: A Deep Dive into SiteMap®-Enabled GIS Utility Mapping Software
Infrastructure has dramatically evolved over the past fifty years.
We've moved from small towns with a few light poles to burgeoning metropolises, and the pace of change shows no signs of slowing. As urban development and transportation networks expand, the effective use of resources and seamless operation of utilities are becoming critical, sometimes even a matter of life or death.
SiteMap® (patent pending), powered by GPRS, is at the forefront of this evolution as a leading provider of utility mapping software. Leveraging Geographic Information Systems (GIS) technology, SiteMap® enables users to visualize, analyze, and manage subsurface utilities with remarkable precision and efficiency. But what sets SiteMap® apart from other solutions?

The Role of Site Mapping Software
Site mapping software is pivotal in infrastructure management, providing a digital platform for visualizing and analyzing spatial data. Traditionally, utility mapping involved labor-intensive manual surveys, paper-based records, and physical inspections. However, the advent of site mapping software has revolutionized this field, offering features like interactive mapping, data integration, and accurate updates. SiteMap® stands out as a premier solution, delivering a comprehensive suite of tools tailored to the unique needs of utility mapping and subsurface infrastructure management.

GIS: Past & Present
The history of linking geographic data dates back to 1854 with Dr. John Snow's cholera map in London, which debunked the theory that cholera was airborne and demonstrated it was waterborne, traced to a specific water pump. This pivotal moment not only sparked the field of epidemiology but also highlighted the problem-solving potential of spatial analysis.
From 1854 to 1960, GIS technology saw limited advancements, remaining largely paper-based. It wasn't until the 1950s that maps began to find utility in the vehicle industry, setting the stage for a technological revolution. Between 1960 and 1975, three major technological breakthroughs—map graphics output on line printers, advances in data storage, and the increased processing power of mainframe computers—paved the way for modern GIS.
Roger Tomlinson, dubbed the "Father of GIS," conceptualized the Canadian Geographic Information System (CGIS) during this period, introducing a revolutionary layering approach to map handling. The U.S. Census Bureau and other entities began to digitize and utilize GIS principles, leading to significant developments in digital mapping by 1971.
From 1975 onward, modern GIS software began to emerge, with significant advancements and wider adoption occurring from the 1990s to today, where GIS is ubiquitous across various sectors, driving innovation and problem-solving worldwide.

Features of SiteMap® Utility Mapping Software
- Interactive Mapping Interface: SiteMap® offers an intuitive and user-friendly interface that enables real-time visualization of underground utilities by overlaying different data layers, enhancing decision-making and risk assessment.
- Data Integration and Analysis: SiteMap® not only facilitates seamless data integration but also enhances existing GIS platforms. Depending on the subscription level, users can upload, edit, and analyze utility information, fostering collaboration and optimizing infrastructure planning and operations.
- Mobile Accessibility: Available as a mobile application, SiteMap® enables field personnel to access utility maps and data on-the-go, supported by GPRS technology for precise navigation and real-time data updates.
- Subsurface Utility Mapping (SUE): Although SiteMap® and GPRS do not offer SUE services directly, the technology supports SUE QL-B, providing critical data for avoiding utility conflicts and ensuring safe excavation activities.
The Impact of SiteMap® on Infrastructure Management
The introduction of SiteMap® has transformed infrastructure management, providing a centralized platform for comprehensive data visualization, analysis, and collaboration. This has led to optimized resource allocation, improved project outcomes, and enhanced decision-making across various sectors, including urban development, transportation planning, and utility maintenance.
As infrastructure continues to evolve and expand, SiteMap® remains a significant advancement in the field, representing a comprehensive solution for managing subsurface utilities. With its cutting-edge features, intuitive interface, and dedication to excellence, SiteMap® is set to drive positive change and shape the future of infrastructure management, ensuring our built environment is efficient, resilient, and sustainable.
GPRS SiteMap® team members are currently scheduling live SiteMap® demos. Click below to schedule your demo today!